
Master industrial IoT monitoring for rotating and electrical assets. Learn sensor selection, data flows, edge vs cloud processing, and maintenance integration.
The popular advice is simple: install more sensors, stream more data, and let analytics find the failures. That advice is incomplete. In heavy industry, the difficult part of industrial IoT monitoring isn't collecting vibration, temperature, or electrical data. It's making sure a trustworthy condition signal reaches the planner, technician, and reliability engineer who can act on it, without exposing legacy operational technology or disrupting equipment that has been running for decades.
The market reflects how quickly connected asset systems have moved into normal industrial practice. One independent estimate places the global industrial IoT market at USD 483.16 billion in 2024, with a projection of USD 1,693.44 billion by 2030, while another estimates USD 310.75 billion in 2024 and USD 846.42 billion by 2030. The estimates differ, but both market analyses point to sustained expansion. The question for a plant manager is no longer whether monitoring is possible. It's whether the monitoring program will produce maintenance decisions instead of another abandoned screen.
Table of Contents
- Why Most Industrial IoT Monitoring Programs Stall at Dashboards
- Core Components of IIoT Monitoring for Rotating and Electrical Assets
- Edge Processing vs Cloud Analytics for Industrial Environments
- Integrating Monitoring Data with Maintenance Workflows
- Building Alerting Strategies That Prevent Alarm Fatigue
- Cybersecurity and Legacy OT Constraints in Monitoring Deployments
- Real-World Implementation Patterns and Lessons Learned
Why Most Industrial IoT Monitoring Programs Stall at Dashboards
More sensors do not automatically improve reliability. They produce more signals. Without clear ownership, naming conventions, retention rules, alert logic, and maintenance actions, those signals collect in a data graveyard.
The adoption picture exposes the gap between connected equipment and usable information. OECD analysis found that IoT technologies had been adopted by an average of 31% of manufacturing enterprises in European countries and 22% in Canada, while adoption in the energy sector reached 47% in European countries and 46% in Canada. Separate manufacturer survey data cited in the same OECD discussion of IoT adoption reported that 62% of manufacturers had incorporated IoT into manufacturing or assembly processes, and 87% of manufacturing decision-makers favored adoption. Hardware is reaching plants. Many programs lose momentum when the resulting signal must enter a maintenance workflow.
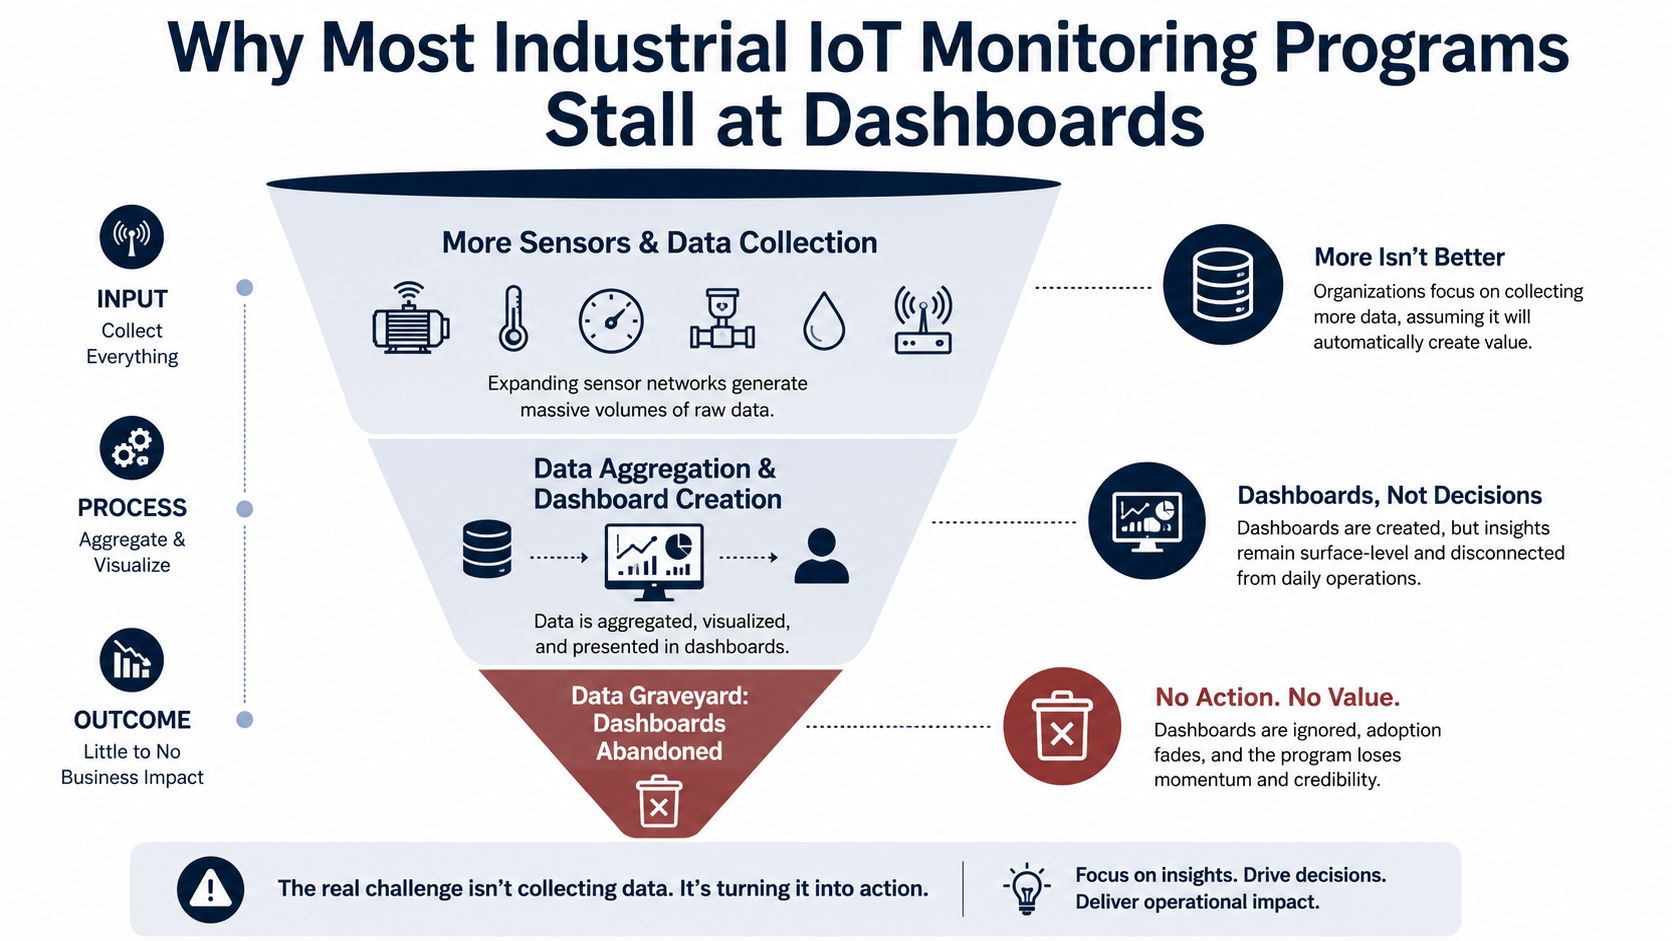
The bottleneck is data usability
A reliability team needs an asset identity, a credible baseline, operating context, severity, a recommended inspection, and a route into the existing maintenance process. A vibration trend without operating speed, load state, sensor location, or work-order history is difficult to interpret. A current anomaly must also be tied to a specific drive, motor, feeder, or process condition before a technician can act on it.
Dashboard launch is only an early milestone. Operations may own equipment data, IT the network, maintenance the CMMS, and reliability engineering the analysis. If no person owns the complete path from measurement to completed intervention, every group can finish its assigned task while the plant receives no useful decision.
Practical rule: Treat every alert as an unfinished maintenance action until someone can explain who receives it, what happens next, and where the result is recorded.
Build the exit before expanding the funnel
Before adding a sensor, define the failure mode it should detect and the action that follows. For a motor driving a critical pump, that action might include confirming bearing condition, checking lubrication, reviewing alignment, and creating a planned inspection. For a VFD, it may require correlating heatsink temperature, output current, fault history, cabinet contamination, and cooling performance before authorizing a restart.
The monitoring path should also preserve enough context for root-cause analysis without forcing every legacy device onto a new network. Use existing signals where they are trustworthy, add targeted measurements where uncertainty remains, and pass only the information needed by maintenance and reliability teams.
ABI Research's reporting on the industrial IoT data management gap describes broad confidence in collecting equipment data but lower confidence in analyzing it and using it in enterprise workflows. Project priorities should reflect that difference. Governance, integration, and workforce adoption usually deserve attention before another round of instrumentation.
Core Components of IIoT Monitoring for Rotating and Electrical Assets
A useful monitoring architecture has three practical layers: measurement, data acquisition, and decision support. The layers must be designed together. A technically excellent sensor still fails if the gateway can't preserve data during an outage, and a capable analytics platform still fails if the asset model doesn't match the maintenance system.
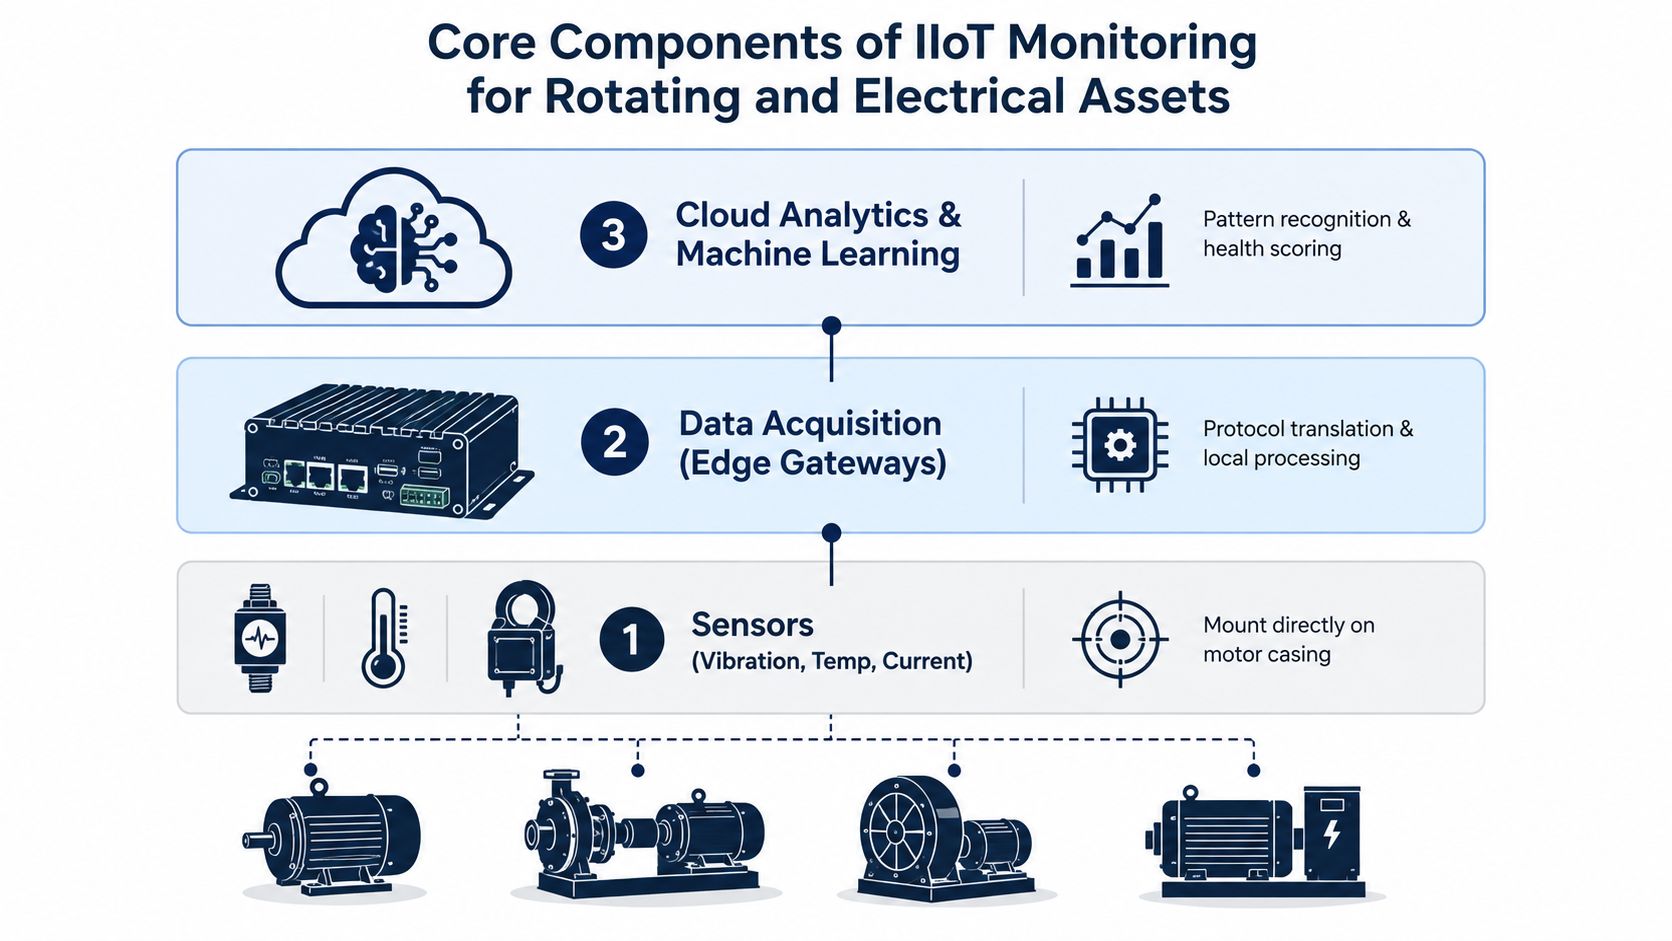
Measurement must match the failure mode
For rotating assets, triaxial vibration sensing can help distinguish changes in radial and axial behavior, but placement matters as much as sensor selection. Mounting on a rigid bearing housing generally produces more useful information than attaching a sensor to a thin guard or flexible panel. Sampling requirements should follow the diagnostic objective. Bearing fault detection needs higher-frequency information than a simple overall vibration trend, while a slow temperature trend may need far less frequent transmission.
Thermal sensing near motor windings, bearings, or drive cabinets must tolerate the actual environment, including heat, dust, moisture, and chemical exposure. Current transformers provide a valuable non-invasive way to observe load behavior and electrical anomalies without modifying an aging drive's control circuit. They can also help correlate mechanical symptoms with process loading, which prevents the team from treating every current change as an electrical fault.
For VFDs and switchgear, the signal list should include available drive parameters, fault codes, operating state, output current, thermal indicators, and relevant process values. Don't collect every register because it's available. Start with the parameters that support a known diagnostic decision.
Gateways protect continuity
An edge gateway should support the protocols already present at the site, such as Modbus, OPC-UA, and MQTT, while separating protocol translation from control logic. Rugged enclosures, suitable temperature tolerance, electromagnetic compatibility, secure authentication, and local buffering matter more than a glossy dashboard.
A gateway that loses packets during a network interruption can erase the very event the team needs to investigate. Local buffering allows the system to retain telemetry and forward it after communications recover. It also permits local filtering, aggregation, and event-triggered capture, which reduces unnecessary traffic and keeps the monitoring path independent from the control loop.
The enterprise layer needs an asset vocabulary
Time-series storage, message handling, and APIs are infrastructure, not the final outcome. Every record should map to a stable asset identifier, location, equipment class, sensor position, engineering unit, timestamp, and quality state. Without that structure, historical analysis becomes a manual reconciliation exercise.
Interoperability deserves deliberate design. ISO/IEC 30162:2022 defines compatibility requirements for IIoT entities exchanging information through agreed transmission protocols, interoperability models, connectivity frameworks, and transport or network models. In practice, that reduces custom adapters between drives, gateways, analytics, and maintenance systems. A well-structured monitoring layer can then support predictive maintenance in manufacturing without forcing a site to replace functional legacy controls.
Edge Processing vs Cloud Analytics for Industrial Environments
Edge and cloud processing solve different problems. The edge is close to the asset, so it can react when network latency, bandwidth, or availability makes remote processing unreliable. Cloud analytics is stronger for comparing many assets, retaining broad historical context, and training models across sites.
A high-speed compressor illustrates the distinction. The gateway can calculate local spectral features, detect a change in operating behavior, and trigger a higher-resolution capture without sending every raw waveform away from the plant. A multi-site reliability group may then send selected features and event records to a central environment for fleet comparison and engineering review.
Remote sites create a similar trade-off. Mining operations, isolated utilities, and geographically dispersed process assets often have constrained backhaul. Sending continuous raw data can be wasteful, while transmitting only a final health score can remove the evidence needed for diagnosis. A hybrid pattern keeps the diagnostic minimum at the edge, then uploads a richer event package when the system detects a meaningful deviation.
| Scenario | Edge Processing | Cloud Processing | Recommended Approach |
|---|---|---|---|
| Fast fault indication on a critical compressor | Low-latency feature extraction and local event logic | Useful for later investigation and model improvement | Detect locally, preserve the event, upload evidence |
| Remote asset with constrained connectivity | Filters, compresses, and buffers data during outages | Receives summaries and selected diagnostic records | Keep routine processing at the edge |
| Fleet comparison across several plants | Supplies standardized features and event metadata | Compares similar assets and operating histories | Centralize normalized data |
| Legacy drive with fragile communications | Reads without changing the control loop and stores locally | Avoids dependence on continuous connectivity | Use read-only acquisition with buffered forwarding |
| Root-cause analysis after a trip | Captures pre-event and post-event context | Correlates electrical, mechanical, and process histories | Combine local capture with central investigation |
The most resilient architecture is usually hybrid, read-only, and event-driven. It doesn't force a plant to choose between local responsiveness and enterprise visibility. It assigns each task to the layer that can perform it with the least operational risk.
Integrating Monitoring Data with Maintenance Workflows
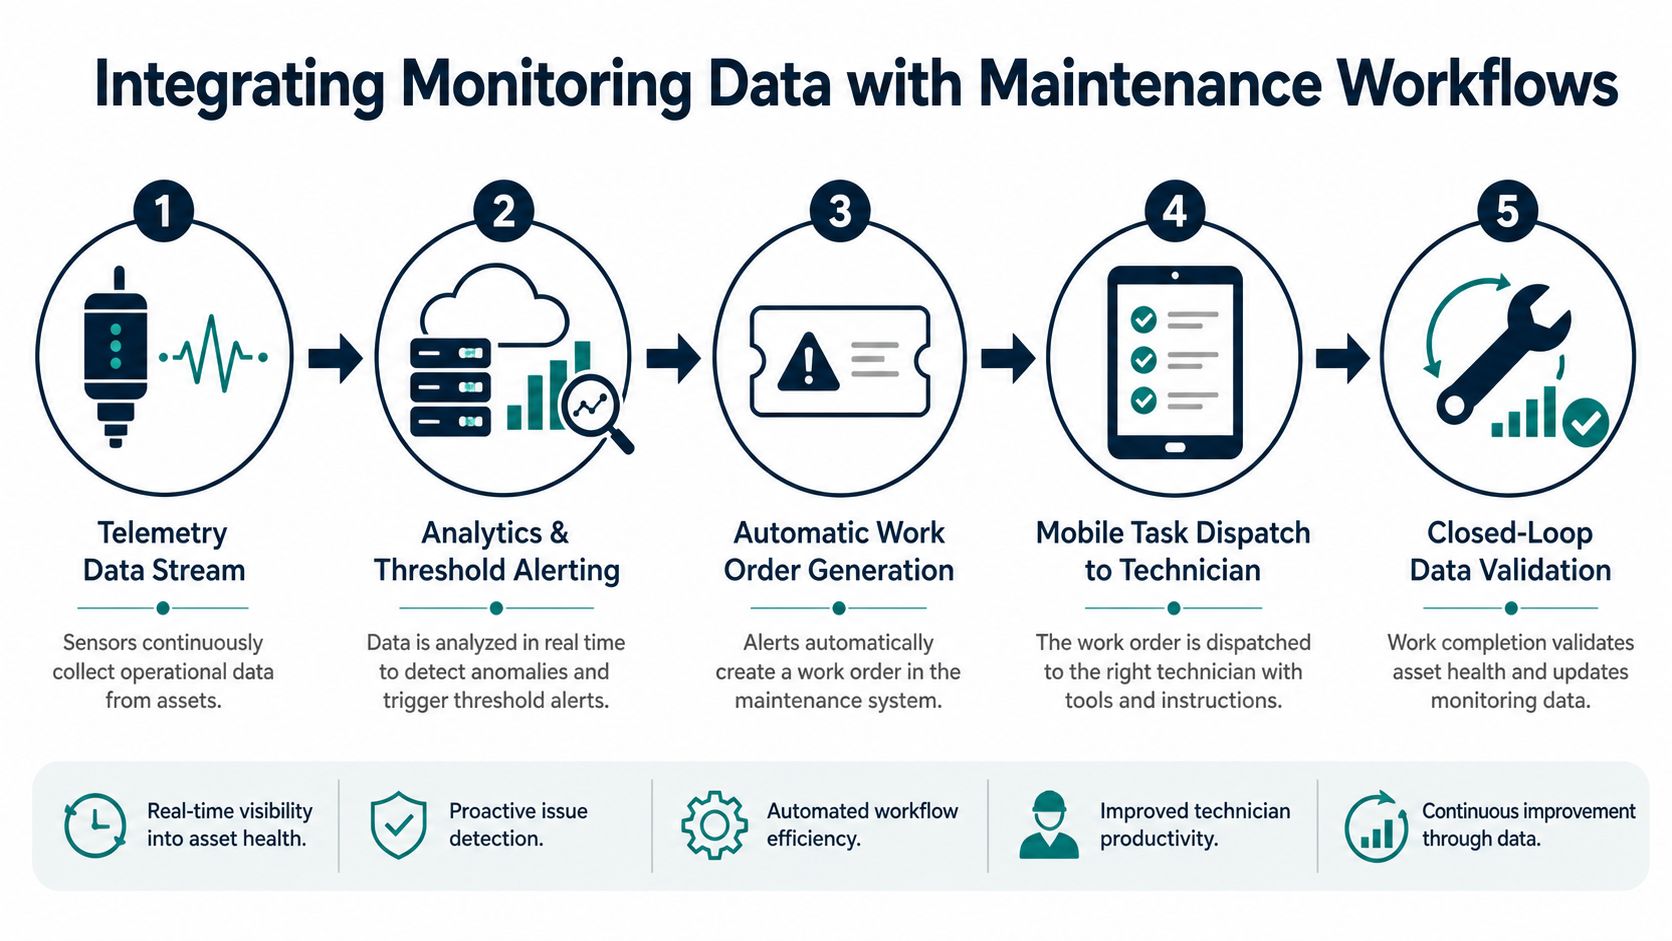
A monitoring platform becomes useful when it can create a clear maintenance decision. The integration doesn't need to automate every task on the first release, but it must connect condition evidence to asset criticality, planning, execution, and feedback.
Start with the asset record
First, reconcile the monitoring asset list with the maintenance master data. Confirm the equipment hierarchy, functional location, tag, drive or motor identity, sensor position, and criticality ranking. Duplicate names are a common source of bad work orders. A dashboard may show “Pump 4,” while the CMMS contains several pumps with similar descriptions and no shared identifier.
Next, define the condition event. “High vibration” is too vague. A useful event states the asset, measured condition, operating context, trend direction, confidence or data quality, and recommended verification. The alert should point to an inspection or diagnostic action, not merely announce that a threshold was crossed.
Convert condition into controlled execution
Use a rule layer between analytics and work-order creation. That layer can apply persistence requirements, suppress known process transients, check asset criticality, and select a priority code. A severe condition on a production-critical motor may route to the reliability engineer and maintenance planner, while a developing issue on a non-critical fan can enter the next planned-work queue.
A practical work order should carry:
- Asset identity: Include the exact equipment tag, sensor location, and affected component.
- Condition evidence: Attach the relevant trend, event timestamp, operating state, and diagnostic feature.
- Verification step: Ask the technician to inspect a defined condition, such as looseness, lubrication, alignment, cooling, or cable termination.
- Decision path: State what should happen if the inspection confirms or rejects the suspected fault.
- Feedback field: Capture the actual finding, repair performed, and post-maintenance condition.
This pattern works across enterprise maintenance systems through APIs, message interfaces, or controlled exports. The technology matters less than the data contract. A work order created without context becomes noise, and a useful alert that requires manual copying from one system to another will eventually be skipped.
The closed loop is the product. The dashboard is only the observation point.
After the job closes, return the technician's finding to the monitoring record. If a suspected bearing issue turns out to be misalignment, the team should be able to refine the rule, update the failure-mode library, and preserve the learning for similar assets. A digital twin and predictive maintenance workflow becomes more valuable when it reflects verified field conditions rather than only algorithmic predictions.
The workflow should also provide a controlled exception path. Technicians need to reject an alert with a reason, planners need to defer work with a documented date, and reliability engineers need to distinguish a bad sensor from a real equipment condition. Without those options, teams either over-maintain equipment or work around the system.
<iframe width="100%" style="aspect-ratio: 16 / 9;" src="https://www.youtube.com/embed/eUENPed8cfo" frameborder="0" allow="autoplay; encrypted-media" allowfullscreen></iframe>Building Alerting Strategies That Prevent Alarm Fatigue
An alert is valuable only when its recipient can respond appropriately. Sending every threshold breach to every person creates defensive behavior. Technicians learn to dismiss notifications, planners stop trusting priorities, and important conditions compete with routine noise.
Use a staged alert architecture. Advisory signals support observation and trend review. Actionable alarms require a defined inspection or planning decision. Critical events require immediate escalation and may invoke an operating procedure. The exact engineering limits depend on machine type, speed, mounting, process state, and manufacturer guidance, so generic thresholds should never replace equipment-specific validation.
Design the logic around persistence
Static limits are a starting point, not a complete strategy. A transient process upset may briefly raise vibration without indicating damage. A slowly rising trend may be more important than a single value below an alarm boundary. Rate-of-change logic, persistence timers, operating-state filters, and comparison with related signals can reduce unnecessary escalation.
For a rotating asset, the logic might require a condition to persist across defined measurements, occur during a valid operating state, and agree with temperature or electrical behavior. For a VFD, the rule could correlate thermal rise with load, cooling-fan status, fault history, and cabinet conditions before creating a high-priority task.
| Alert Tier | Vibration Threshold (mm/s RMS) | Response Action | Routing Target | Response SLA |
|---|---|---|---|---|
| Advisory | Site-validated developing condition | Review trend and operating context | Reliability dashboard owner | Planned review |
| Warning | Site-validated persistent deviation | Schedule inspection and verify likely causes | Planner and area maintenance lead | Defined planning window |
| Alarm | Site-validated severe or accelerating condition | Inspect promptly and assess operating risk | Reliability engineer and operations supervisor | Shift-specific escalation |
| Danger | Site-approved emergency condition | Follow approved operating and protection procedure | Operations control and maintenance leadership | Immediate response |
The table deliberately avoids universal numerical limits. A value that is concerning on one machine may be normal on another, and standards such as ISO vibration guidance still require engineering interpretation.
Match routing to consequence
Asset criticality should control the recipient and response expectation. A critical process pump deserves a shorter escalation path than a spare ventilation fan. Alert ownership must also be named by role, not just by a shared mailbox. If a person is unavailable, the system needs an approved fallback.
Wireless monitoring may demand especially careful design because closed-loop control, asset tracking, and transport safety applications can target about 99.999% reliability, as described in research on industrial wireless sensor network reliability. Monitoring alarms don't automatically become control commands, but the reliability requirement still reinforces the need for buffering, link-quality checks, graceful degradation, and visible data-quality states.
Cybersecurity and Legacy OT Constraints in Monitoring Deployments
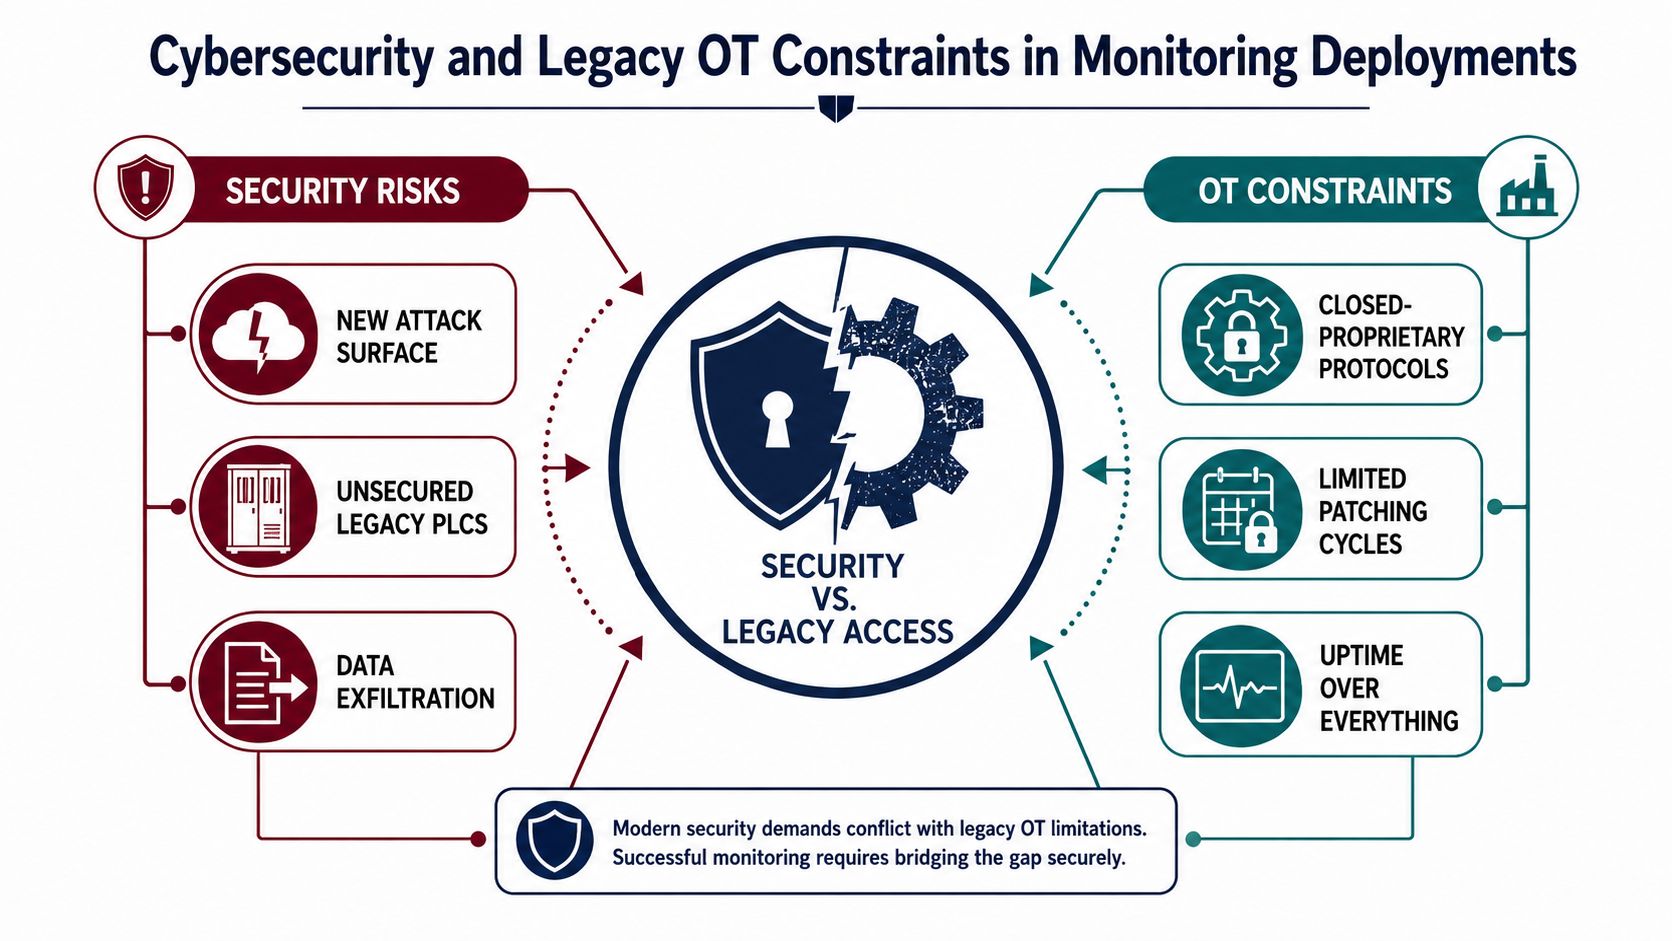
Bolt-on monitoring can improve visibility while expanding the number of devices, pathways, credentials, and software components that a site must govern. Legacy PLCs, older HMIs, unencrypted field protocols, and long patch cycles turn a normal IT integration into an operational risk decision.
The safest starting point is usually read-only acquisition. A monitoring gateway should observe drive and process parameters without writing commands into the control system unless the control function has been separately engineered, reviewed, tested, and approved. The monitoring network should be segmented from control networks, with tightly controlled paths through an industrial DMZ or equivalent boundary. Where the risk assessment requires it, one-way transfer can allow telemetry to move outward without permitting inbound traffic toward sensitive equipment.
Document the path, not just the device
For every sensor and gateway, record what it measures, where it connects, which protocol it uses, where credentials are stored, what data leaves the site, and what happens when communications fail. This inventory should include firmware ownership, certificate rotation, remote-access rules, backup configuration, and end-of-life treatment.
Legacy equipment may not support encryption or modern authentication. Don't pretend that a protocol becomes secure because it passes through a new gateway. Compensating controls can include network isolation, allow-listed communications, physical access protection, restricted engineering laptops, monitoring of unusual traffic, and a clear procedure for removing a compromised device.
AI adds another governance layer. Independent reporting on OT cybersecurity found that 87.7% of respondents in a 2026 survey were using, evaluating, piloting, or planning AI, with 33.8% already using it for threat detection and alerting and 31.5% for network monitoring and anomaly detection. The report on AI and OT security governance also notes that enterprise IoT spending growth slowed to 10% in 2024, its lowest rate in over a decade. These figures point to a practical buying environment: organizations are interested in AI, but they need controlled scope, explainable outputs, and evidence that monitoring adds operational value.
Governance test: If the team can't explain how an algorithm reached an alert, who can override it, and how the decision is recorded, the feature isn't ready to influence a critical maintenance action.
Keep AI advisory until the site has validated the model against field findings. Protect sensitive operational data, restrict model access, and establish a fallback that doesn't depend on cloud availability. Security and reliability aren't opposing goals. A properly designed architecture gives maintenance more information while giving control systems less exposure.
Real-World Implementation Patterns and Lessons Learned
The most dependable rollout pattern starts with a small group of high-consequence assets. Large pumps, compressors, critical motors, and troublesome drives usually offer clearer diagnostic objectives than broad, low-selectivity coverage. The team can prove the data path, alert quality, technician response, and work-order feedback before expanding into switchgear, transformers, and secondary equipment.
A typical failure begins with installation rather than analytics. A wireless sensor mounted on a flexible cover can produce unstable readings. A gateway polling too aggressively can burden a legacy controller or create incomplete records. A cabinet sensor placed near a heat source without process context can create repetitive warnings that technicians learn to ignore.
What successful sites do differently
Successful programs assign a reliability owner to the data pipeline. IT and automation teams support connectivity and security, but a reliability engineer decides which failure modes matter, what evidence is sufficient, and what action belongs in the maintenance workflow.
The rollout should have explicit gates:
- Asset and failure-mode selection: Document the consequence, suspected failure mechanism, measurement, and maintenance response.
- Data-quality acceptance: Verify timestamps, sensor identity, operating-state context, buffering, and communications behavior.
- Alert acceptance: Test advisory, actionable, and critical paths with the people who receive them.
- Workflow acceptance: Confirm that a condition can become a planned task, be completed, and return a verified finding.
- Expansion review: Add coverage only after the team can show that existing signals are used consistently.
The business case also needs discipline. Sites may identify value relatively quickly on high-criticality assets, but broader coverage is harder to justify when alerts aren't linked to scheduling and execution. Don't promise a universal payback period. Measure avoided emergency work, better outage planning, improved fault diagnosis, and the quality of completed maintenance records.
DUCHENG Industrial offers lifecycle VFD services alongside smart O&M and IoT consulting, including monitoring architecture, data arrangements, drive parameter collection, condition visualization, health and trend analysis, fault and alarm workflows, and spare-parts management. That combination matters on sites where the monitoring signal must be interpreted alongside commissioning history, cabinet condition, repair records, and the practical limits of legacy drive equipment.
Sustainable industrial IoT monitoring treats sensor data as an operational asset. Give it an owner, a retention policy, a security boundary, a maintenance meaning, and an escalation path. If the project can't answer what happens after the dashboard changes color, it isn't ready to scale.
If your plant needs VFD condition visibility that connects monitoring with diagnosis, maintenance planning, and lifecycle support, visit DUCHENG Industrial to discuss a practical architecture for your assets. Share your drive types, critical equipment, legacy control constraints, and current maintenance workflow so the monitoring plan can be designed around actions, not another disconnected dashboard.