
Master predictive maintenance manufacturing with sensor strategies, analytics, and pilot-to-scale programs. Learn how to reduce downtime and extend asset life.
Stop treating predictive maintenance as a blanket software rollout. In manufacturing, the winners don't start by wiring every asset to an AI model. They start by asking which machines are critical, which ones already have useful data, and which failures are expensive enough to justify action before the outage happens.
That shift matters because maintenance is still mostly reactive in many plants. NIST reported 17.3% predictive maintenance, 31.8% preventive maintenance, and 45.7% reactive maintenance in U.S. manufacturing machinery establishments, which tells you how much room still exists to move from breakdown response to condition-based action (NIST study). Predictive maintenance manufacturing works when it solves a real economic problem, not when it becomes a dashboard full of alerts.
Table of Contents
- Why Most Predictive Maintenance Programs Start Wrong
- The Evolution from Reactive to Predictive Maintenance
- Matching Sensors to Failure Modes on Rotating Equipment
- Which Assets Deserve Predictive Monitoring First
- Connecting Predictions to Repair and Lifecycle Decisions
- Building Your Pilot to Scale Roadmap
- Measuring What Matters in Predictive Maintenance Programs
Why Most Predictive Maintenance Programs Start Wrong
Most predictive programs fail for the same reason: teams begin with technology instead of economics. They buy sensors, build dashboards, and try to cover too much too soon, even though the first question should be which assets are worth the effort. A broad rollout looks ambitious, but it usually creates noise, slow adoption, and a pile of data nobody trusts.
Start with the assets that can prove value
The right first candidates are operationally critical, already well instrumented, and backed by enough failure history to train a useful pattern. McKinsey's guidance is blunt on this point, prioritize assets that are critical, data-rich, and supported by historical failures or anomalies, because low-instrumentation assets are often poor early PdM candidates even if they're expensive when they fail (McKinsey). That's the filter most plants skip.
Practical rule: if you can't explain why a specific asset deserves monitoring in one sentence, it probably doesn't belong in the first pilot.
A good pilot usually starts with a small set of machines that sit near the bottleneck, carry high consequences when they trip, and already produce usable signals. In practice, that often means a few motors, pumps, compressors, conveyors, or drives rather than an entire line. The goal isn't to monitor everything. The goal is to win on the assets where the result is visible quickly.
Avoid the factory-wide AI trap
A factory-wide rollout sounds efficient, but it hides weak assumptions. If a machine has little sensor coverage and almost no labeled failure history, the model can't learn much that's reliable. The program then spends months producing alerts that maintenance teams can't validate, which is how PdM gets labeled “interesting” and then ignored.
The better pattern is narrow proof, then expansion. Start with the five to ten assets where you can prove avoided downtime, reduced emergency work, or better scheduling inside a short pilot window. Once those assets produce clean evidence, the rest of the plant becomes easier to justify because the economics are already real, not hypothetical.
That's why predictive maintenance manufacturing should be treated like portfolio management. You're not buying a philosophy, you're choosing where the data, the risk, and the return intersect first.
The Evolution from Reactive to Predictive Maintenance
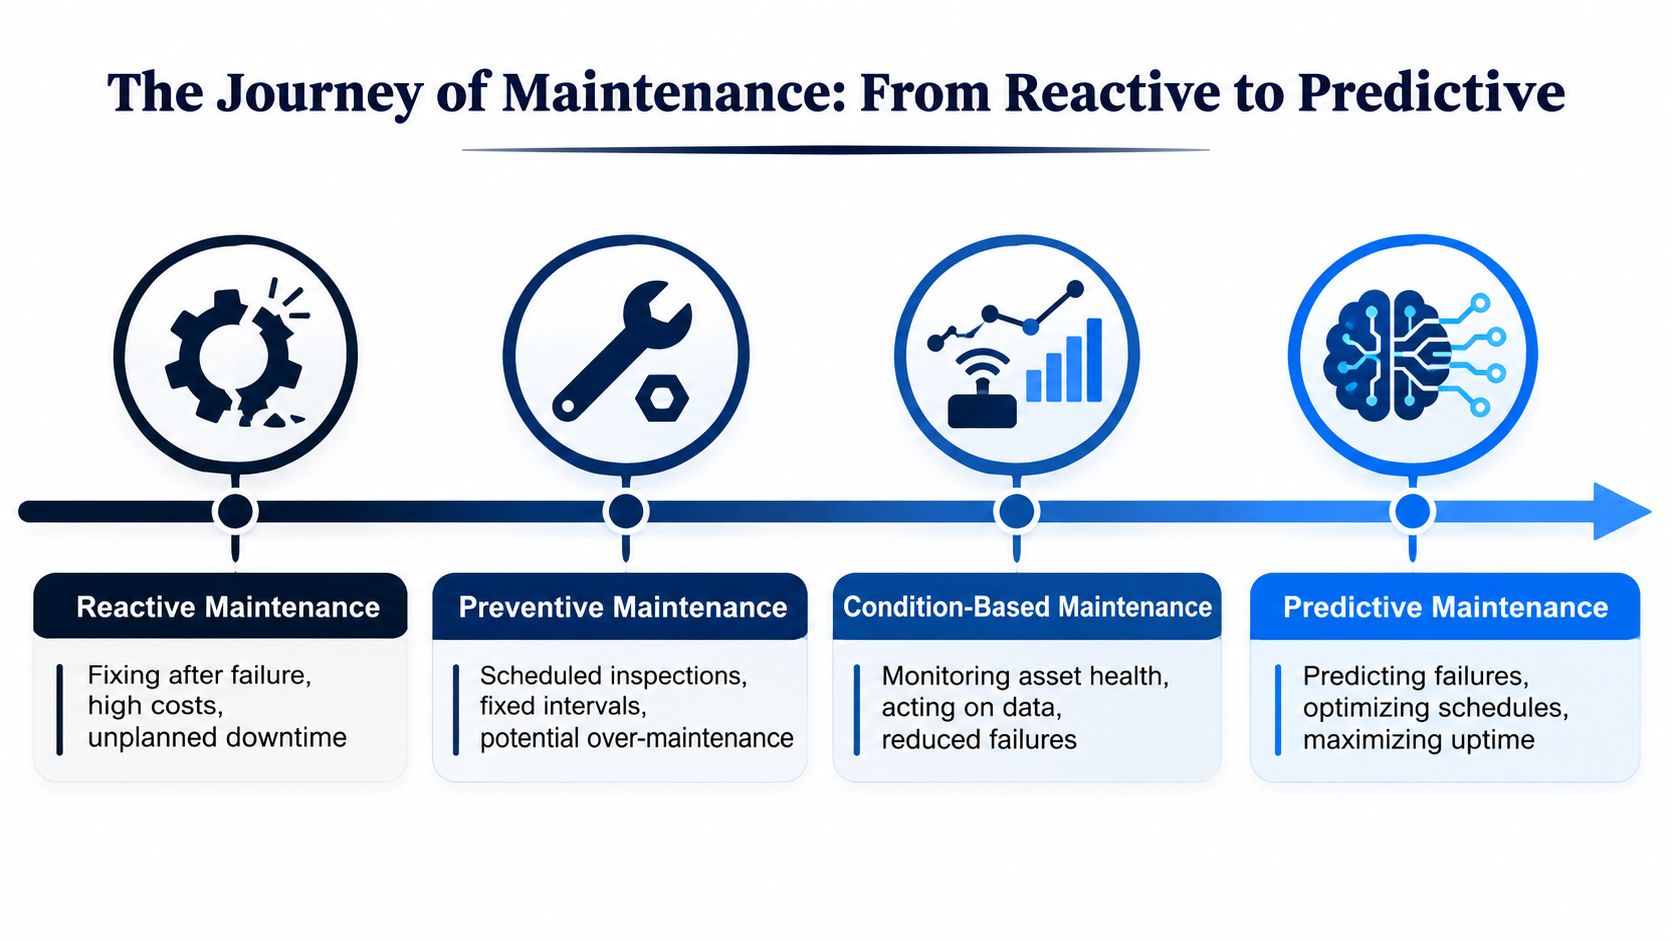
Maintenance strategy has shifted from fire-fighting to condition-based decisions, but the change has not been straight or clean. Many plants spent years in a reactive loop, fix the failure, restart the line, move on. Preventive routines brought more discipline, yet fixed intervals still pushed work too early on healthy assets or too late on parts already headed toward failure.
The market has moved from experiment to operating tool
PdM is no longer a niche bet. Industry reporting has shown that adoption keeps widening across manufacturing, and that shift matters because plants do not keep paying for systems that never leave the pilot stage. The point is not that every site is mature. The point is that more teams now expect predictive maintenance to produce usable work orders, not just dashboards.
The economics explain why. Fortune Business Insights reports market forecasts in the low-to-mid teens of billions of dollars in 2025, with growth projected through the 2030s, and cites operational gains such as 20% to 30% reductions in equipment downtime, up to 25% reductions in maintenance cost, and as much as 50% lower unplanned downtime in some deployments (Fortune Business Insights). For plant leaders, those numbers translate into output protection, less emergency labor, and fewer asset failures that spill into production loss.
What that means on the shop floor
Reactive maintenance still has a place on low-consequence assets, but it is a poor default for expensive bottlenecks. Preventive maintenance still makes sense when failure behavior is well understood and instrumentation is limited. Predictive maintenance belongs above both when the asset matters enough, the signal quality is good enough, and the organization can act on the warning before damage spreads.
The practical shift is simple. PdM is no longer treated as a proof of concept by itself. It is used to decide which assets deserve attention first, where instrumentation pays back, and whether a late-life machine should be repaired, kept under watch, or replaced before the next major failure.
Matching Sensors to Failure Modes on Rotating Equipment
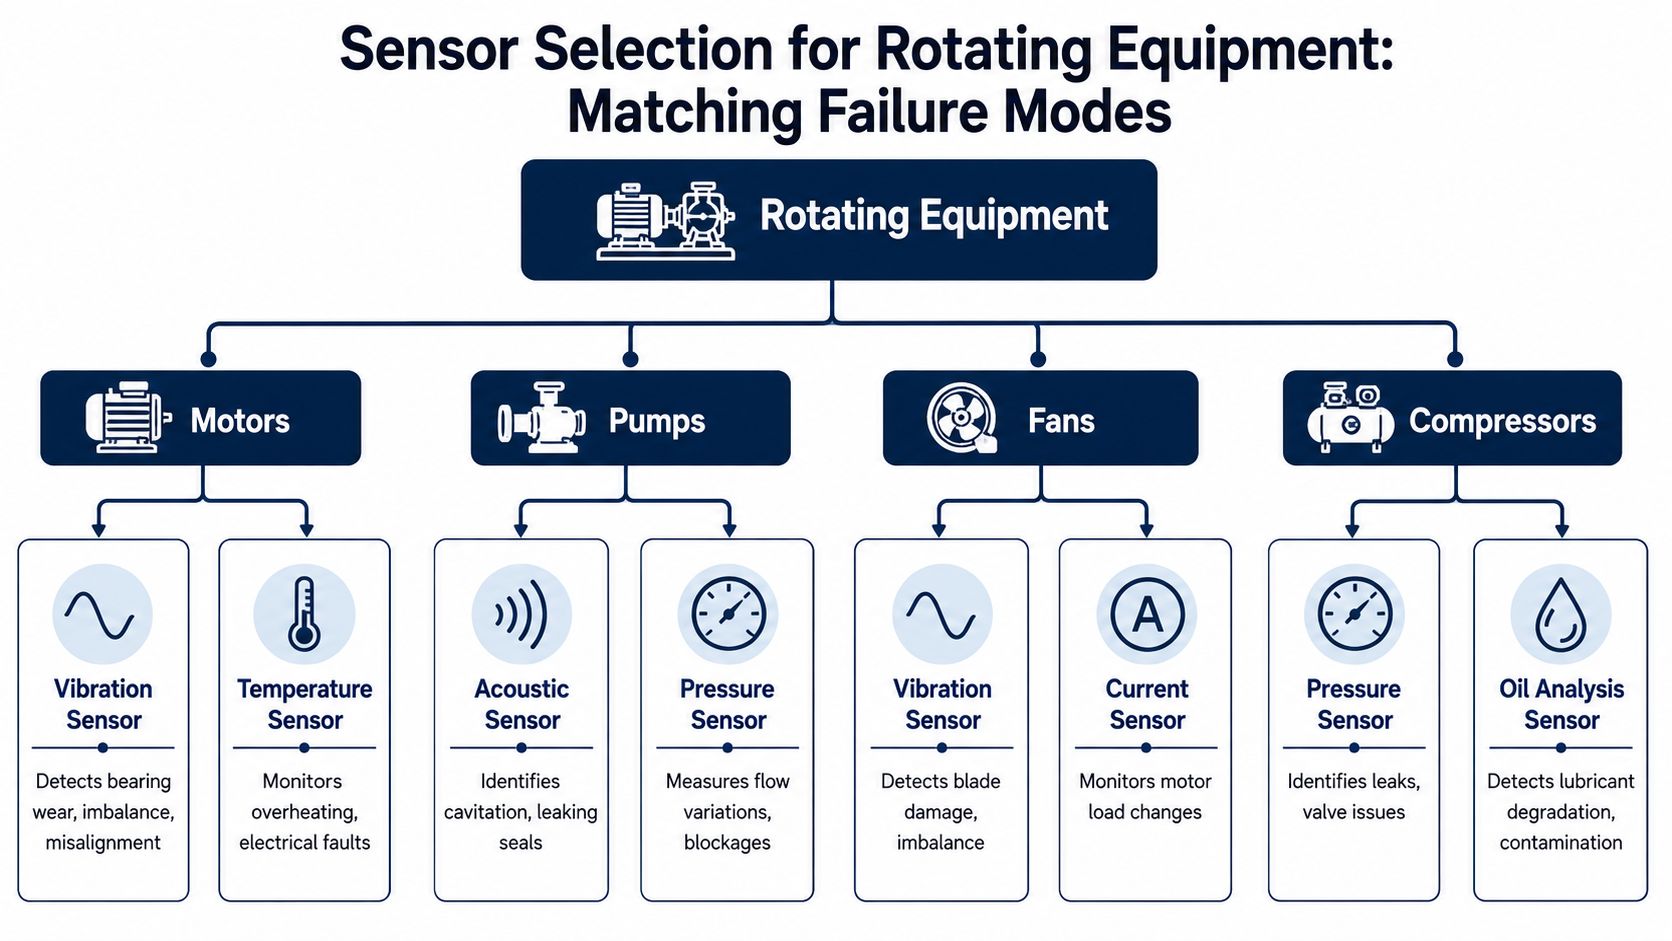
The most common mistake in PdM is buying sensors before defining failure modes. On rotating equipment, the sensor only helps if it matches the fault you're trying to detect. A vibration channel on the wrong machine, or a temperature tag with no operating context, just adds data volume.
Build the sensor plan from the failure mode backward
For motors, pumps, fans, compressors, and conveyors, vibration is the first-line signal when you're looking for bearing wear, imbalance, misalignment, looseness, or gear-mesh faults. Electrical issues need different evidence. Motor voltage and current waveforms are what surface supply imbalance, harmonic distortion, winding faults, and rotor-bar defects.
That distinction matters because a plant can have excellent vibration coverage and still miss an electrical problem until it becomes a trip. It also means a sensor package should reflect the asset's dominant failure modes, not a generic bundle a vendor recommends for everything.
If the failure mode is electrical, vibration alone won't save you. If the failure mode is mechanical, a current trace can look fine right up until the bearing gets ugly.
Don't ignore operating state
Process context is what keeps good data from turning into false alarms. A motor drawing more current during a legitimate load increase isn't failing, it's doing the job it was told to do. Without speed, load, or operating-state context, the alert logic can't tell the difference between normal production variation and fault precursors.
The practical setup is simple. Pair condition signals with operating state, then test the relationship against historical faults. For variable frequency drives, that usually means monitoring what the drive is doing, not just what the motor looks like from the outside. That's also where site engineers get the most value from a layered signal strategy, vibration for mechanical health, current for electrical behavior, and process context for interpretation.
Keep the setup tight
A useful package doesn't need every possible sensor. It needs the few that map cleanly to the faults you care about. In plants I've seen succeed, the instrumentation plan was short enough to explain to maintenance techs, but specific enough that no one had to guess why an alert fired.
That's the difference between useful condition monitoring and expensive telemetry. One helps a crew make a call. The other just fills a historian.
Which Assets Deserve Predictive Monitoring First
Not every expensive asset deserves PdM first. A high-cost machine with sparse failure history and little sensor coverage can be a poor early candidate, because you'll spend more time building the data foundation than capturing value. A moderately critical asset with repeatable behavior and visible failures can deliver faster proof.
A simple ranking logic
Use three questions. First, how bad is the failure for production, safety, or quality? Second, how much useful sensor coverage already exists? Third, do you have enough failure history or anomalies to train and validate the model? If the answer to the first is strong but the other two are weak, that asset may still be important, just not first.
A strong early portfolio is usually a mix of assets with high consequence and usable data. That can include a bottleneck motor train in a steel plant, a critical pump bank in a chemical facility, or a drive system that already has operating records and event logs. The point is to prove PdM where the evidence can move quickly.
| Asset Type | Criticality Score | Sensor Coverage | Failure History | PdM Priority |
|---|---|---|---|---|
| Bottleneck motor and pump set | High | Moderate to strong | Moderate | High |
| Auxiliary fan bank | Medium | Moderate | Moderate | Medium |
| Aging compressor with poor instrumentation | High | Weak | Sparse | Low early priority |
| Conveyor on a non-bottleneck line | Medium | Variable | Limited | Medium to low |
| Drive system with existing operating data | High | Strong | Strong | High |
Rank for proof, not pride
A common mistake is choosing the most expensive asset in the plant because it sounds impressive. That can backfire if the machine is too hard to instrument or too unique to model early. The better first assets are the ones where a win is measurable, credible, and repeatable enough to justify the next phase.
Decision rule: monitor the assets that give you the best mix of consequence, coverage, and history, not the ones with the largest replacement tag.
That's the economic reality behind predictive maintenance manufacturing. The right first portfolio is smaller than most executives expect, but it's much more likely to scale.
Connecting Predictions to Repair and Lifecycle Decisions
A prediction without a response plan is just a warning. Value shows up when maintenance leaders decide whether the asset should be repaired, reconditioned, selectively rebuilt, or replaced. That decision gets harder on late-life equipment, where the failure is real but the asset still has enough useful structure left to justify another life cycle.
Build a repairability framework before the alert arrives
Late-life gear needs different thinking than a fresh install. Shutdown windows are tighter, contamination risk is higher, and aging electrical assets can fail in ways that don't always justify full replacement. The question isn't only “what failed?” It's “what's the cheapest safe path to restore dependable service?”
Research on PdM in intelligent manufacturing highlights barriers and success factors that go beyond prediction, including organizational integration and decision-making (Econstor paper). That's exactly where many programs stall. The dashboard says a fault is coming, but no one has defined whether the best action is component swap, targeted refurbishment, or unit replacement.
A practical framework should ask:
- Can the failed subsystem be isolated? If yes, selective repair becomes more realistic.
- Is the asset contamination-sensitive? If yes, the repair window and worksite control matter as much as the part itself.
- Is the remaining service life worth preserving? If yes, reconditioning can make more sense than premature replacement.
- Are spare parts ready? If not, the prediction only creates stress instead of control.
Make the maintenance plan part of the asset strategy
On site, the best outcomes come when predictions trigger both maintenance planning and parts readiness. That turns a failure forecast into a scheduled intervention instead of an emergency call. In heavy industry, the difference between replacing a whole unit and restoring the serviceable subsystems can be the difference between a long shutdown and a managed repair window.
DUCHENG Industrial is one option in this space for multi-brand VFD commissioning, troubleshooting, repair, on-site reconditioning, and spare-part compatibility checks for industrial drive systems. That matters because drive health and lifecycle decisions are often linked, especially when late-life equipment needs selective restoration instead of full replacement.
PdM becomes more than alerting. It becomes a maintenance and lifecycle decision system.
Building Your Pilot to Scale Roadmap
Pilot success doesn't come from data alone. It comes from a clear sequence that turns signals into decisions, then decisions into repeatable operations. A good roadmap makes it obvious when to expand and when to stop.
Start with the minimum viable dataset
One industrial checklist says a credible PdM program needs 90 days of continuous sensor data at 1 Hz or higher and at least 12 months of historical maintenance records with failure labels, timestamps, severity, and root cause. That threshold makes sense. The model needs both the normal operating range and enough failure context to separate harmless variation from real precursors.
If you don't have that baseline, the pilot should focus on instrumentation and record quality first. Otherwise, the team spends months arguing about alert validity instead of improving maintenance decisions.
Use clean stages, not vague ambitions
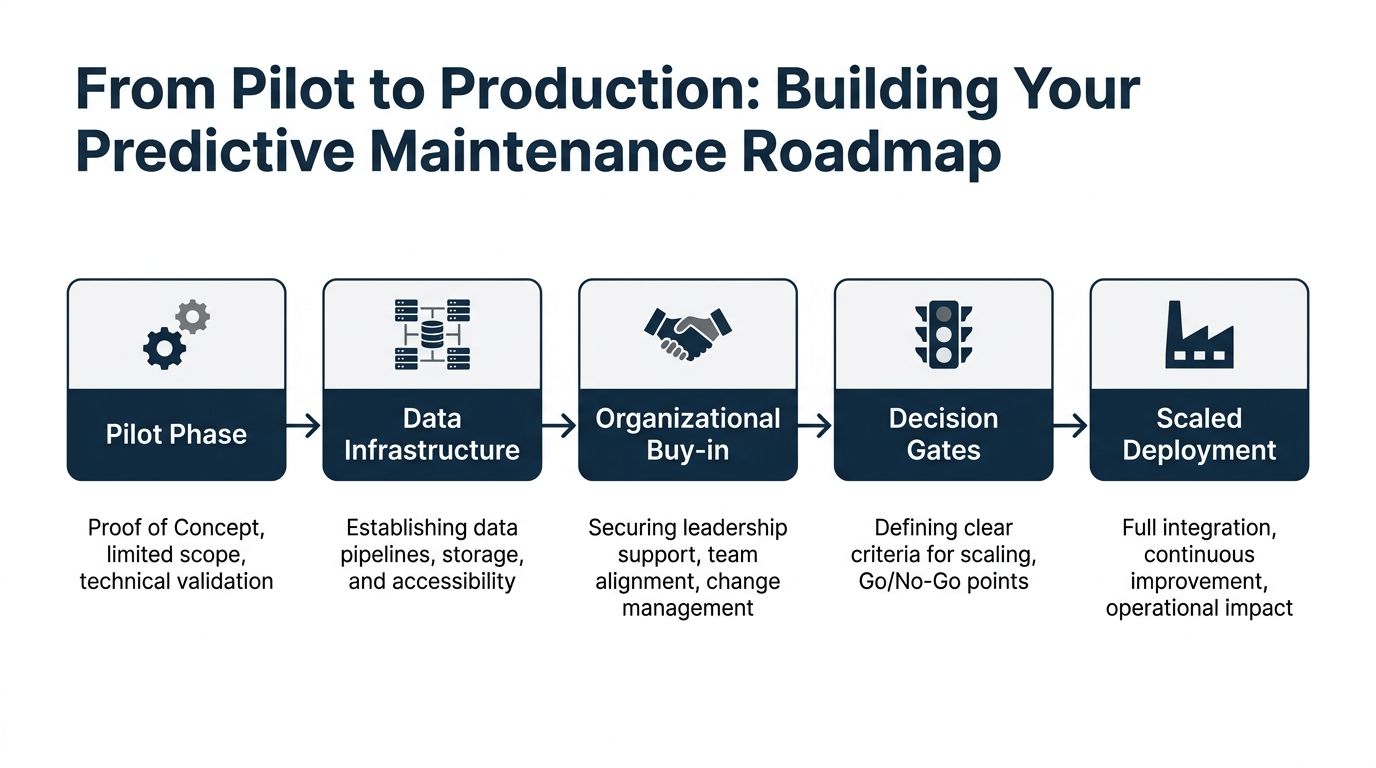
A workable roadmap usually looks like this:
- Pilot phase, limited to a few high-priority assets and one clear failure mode.
- Data infrastructure, with reliable collection, storage, and access.
- Organizational buy-in, so operations, maintenance, and planning all respond the same way.
- Decision gates, where you define what qualifies as a scale decision.
- Scaled deployment, after the first assets prove real operational value.
The reason this structure works is simple, each stage changes the kind of problem you're solving. Early on, it's a sensing and data problem. Later, it's a maintenance workflow problem. After that, it's an organizational standardization problem.
Use the pilot to prove actionability
A pilot that only produces charts hasn't earned expansion. A pilot that supports work order timing, spare-part staging, and better shutdown planning has. If you can show the maintenance team that alerts lead to fewer surprises and more planned work, the next asset group becomes easier to approve.
For teams building a digital layer around maintenance, predictive maintenance and digital twin alignment can help connect condition data to asset behavior, but only if the underlying data and response process are already disciplined.
The test is not whether the model runs. It's whether operations leaders trust the output enough to act on it.
Measuring What Matters in Predictive Maintenance Programs
Many PdM programs celebrate alert volume or model precision and miss the numbers plant leadership uses. Maintenance teams do not get rewarded for busy dashboards. They get rewarded for fewer surprises, more planned work, and lower cost per unit of output.
Track operational impact, not vanity metrics
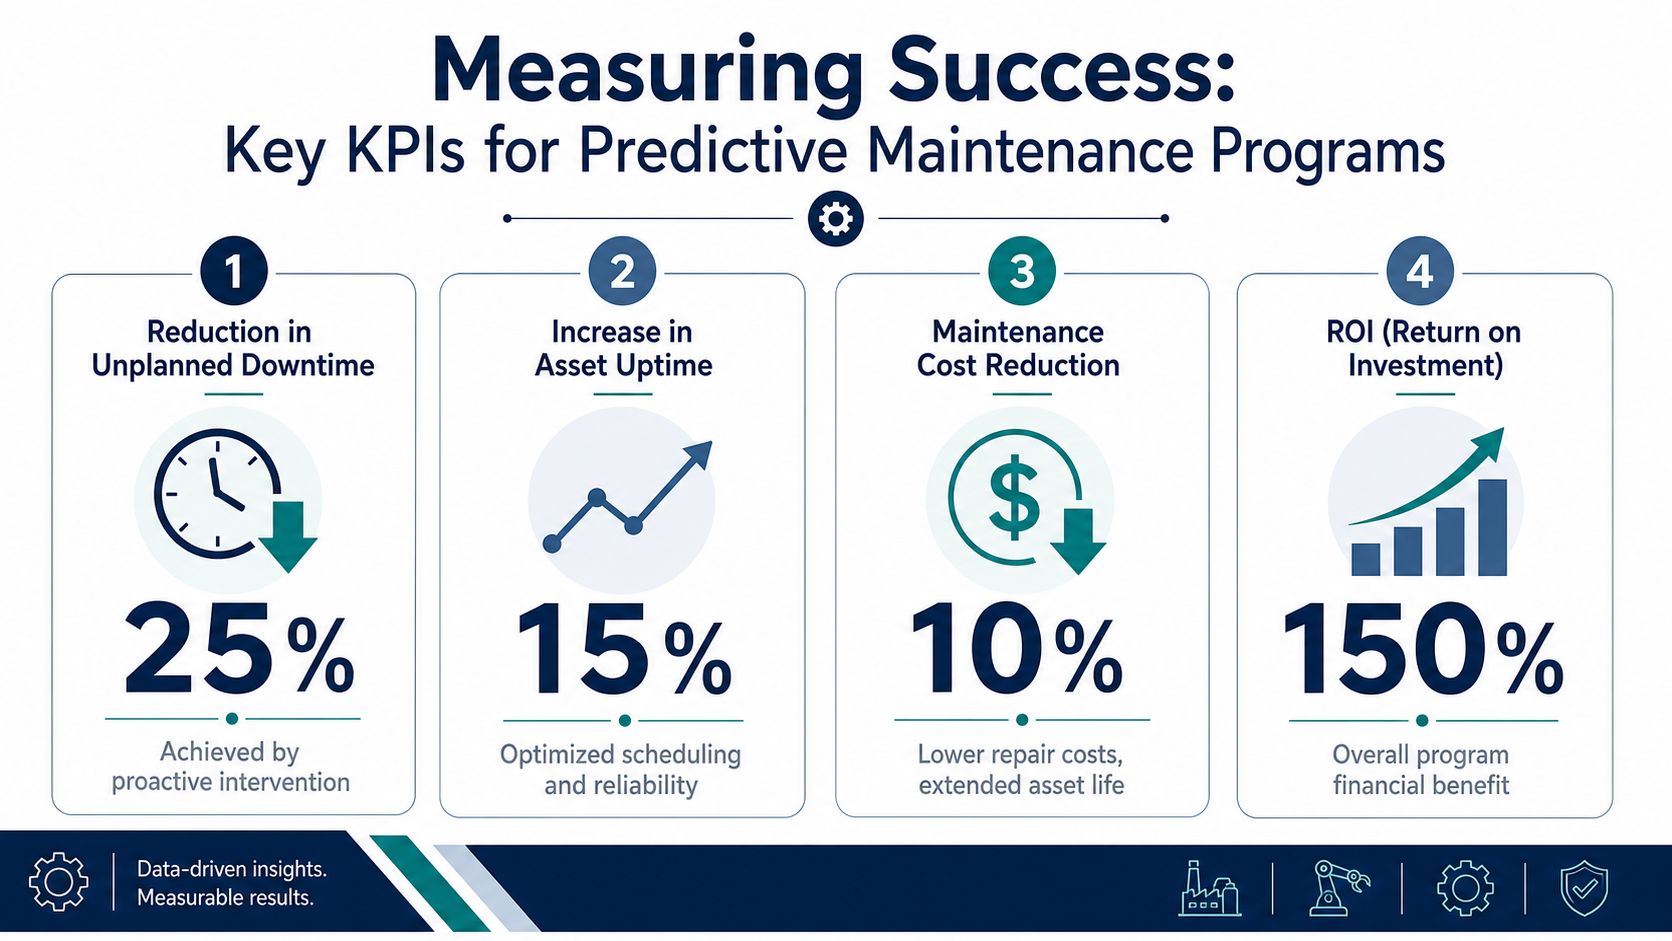
The measures that matter show whether the plant became more predictable. That includes reduced unplanned downtime, maintenance cost per unit of production, mean time between failures on monitored assets, and the share of work that is planned instead of reactive. If those numbers do not improve, the program is not helping, no matter how polished the interface looks.
Those results belong on a leadership dashboard because they connect directly to output protection and maintenance discipline. The point is not to celebrate prediction for its own sake. The point is to show that the plant is catching issues early enough to plan the work and avoid disrupting production.
Make the dashboard speak plant language
Operations leaders care about uptime, schedule adherence, and cost exposure. Technicians care about diagnosis quality and whether alerts are believable. Planners care about whether they can line up labor, spares, and shutdown windows without chaos. A useful dashboard has to serve all three groups without making the message harder to use.
Good reporting answer: “We avoided a trip on the monitored drive, converted two likely breakdowns into planned work, and kept the repair inside the shutdown window.”
That kind of reporting gives the plant something actionable. It also keeps the conversation focused on business outcomes, not model theater.
The best programs also connect predictive findings to repair-versus-replace decisions. On late-life equipment, a recurring fault may justify a controlled repair if the asset still has useful life left, or it may point to replacement if the next failure would consume too much labor, downtime, or spare parts. That is where electrical reliability services fit into the picture, because the response side has to match the prediction side or the plant stays reactive under a different label.
The scorecard should show whether maintenance is becoming more planned, more selective, and less disruptive. That is the measure that tells you predictive maintenance manufacturing is working.