
Learn how industrial IoT predictive maintenance works, from sensors and edge analytics to ROI on drives, with clear steps and real-world examples.
At 2:14 a.m., a 75 kW VFD-driven pump motor on a cooling loop trips. The production line stops, three technicians are paged, and a bearing replacement that might have fitted into planned maintenance becomes a $40,000 unscheduled loss. The immediate repair is visible. The earlier warning, a rising vibration trend, a thermal change, or an abnormal current signature, usually isn't.
That situation is familiar across brownfield plants. New sensors and analytics may sit beside legacy drives, older PLCs, incomplete drawings, and maintenance knowledge held mainly by experienced technicians. Industrial IoT predictive maintenance can create continuous visibility into those assets, but the return doesn't come from installing sensors alone. It comes when reliable data reaches the right person, the person trusts the alert, and the maintenance process can act before failure.
Table of Contents
- From Reactive Repairs to Pre-Failure Action
- What Industrial IoT Predictive Maintenance Actually Means
- The Layered Architecture That Makes It Work
- From Raw Signal to Remaining Useful Life
- Predictive Maintenance Applied to Variable Frequency Drives
- Where the Real ROI Comes From and Where It Disappears
- A Practical Checklist for Getting Started
From Reactive Repairs to Pre-Failure Action
Reactive maintenance starts with a trip, alarm, leak, seized bearing, or burned component. The crew responds after the equipment has already crossed the line from degradation to functional failure. Production loses time, maintenance loses control of the schedule, and procurement may need to find parts under pressure.
Preventive maintenance improves that position by replacing or servicing equipment according to a calendar, runtime threshold, or manufacturer recommendation. It reduces some failures, but it can also replace healthy components too early. A calendar doesn't know whether a pump has operated under unusual load, whether a drive cabinet has accumulated contamination, or whether a bearing has begun developing a fault between scheduled inspections.
Predictive maintenance uses measured condition to decide when intervention is justified. The maintenance manager isn't asking, “Has this motor reached its scheduled service date?” The better question is, “Is this motor showing a degradation pattern that requires a controlled intervention?”
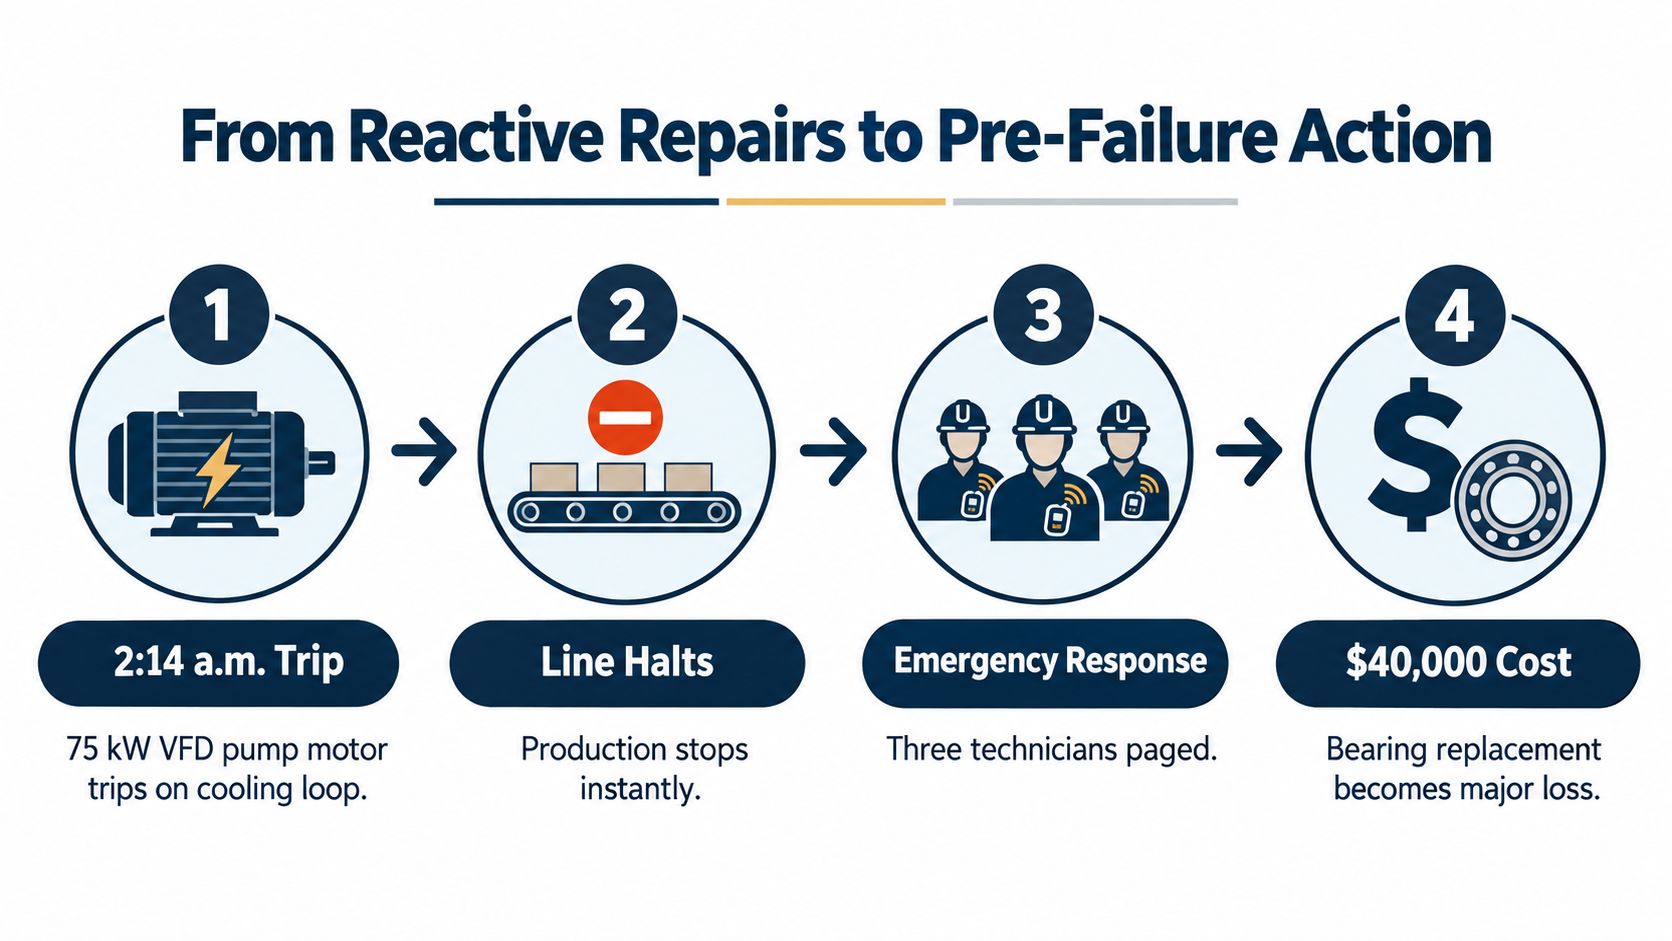
The maintenance maturity curve
Consider the same cooling-loop pump under three strategies:
- Reactive: The VFD trips during a night shift. The team diagnoses the problem while the line is down.
- Preventive: The team replaces the bearing during a scheduled interval, whether or not the bearing is degrading.
- Predictive: A connected monitoring system identifies an abnormal trend. The planner orders the correct bearing, assigns the work, and schedules the repair during a suitable production window.
The third approach doesn't promise that equipment will never fail. It creates an opportunity to intervene while the fault is still manageable. A Tuesday morning bearing change is operationally different from an emergency repair during an overnight stop, even when the physical component is the same.
A University of Politecnico di Milano analysis reported typical reductions of 25% to 30% in maintenance costs, 35% to 45% in downtime, and 70% to 75% fewer breakdowns when predictive maintenance is applied with connected industrial monitoring. The same analysis reported 20% to 40% longer operating life, while a separate 2024 study discussed in that source found AI-based failure-prediction accuracy improvements of 30% to 60%, with maintenance costs 25% to 50% lower.
Practical rule: Predictive maintenance is successful only when an alert can change a maintenance decision.
That rule matters most on brownfield equipment. A legacy drive may not expose every useful parameter, and its control network may not communicate cleanly with modern systems. External vibration, temperature, current, or pressure sensing can add visibility, but the plant still needs a process for validating the signal, approving the work, and recording what technicians found.
The market reflects growing interest in this approach. One 2026 industry estimate valued the industrial predictive maintenance market at USD 14.2 billion in 2025 and projected USD 98.1 billion by 2033, while another estimate in the same source placed the 2025 value at USD 14.09 billion and projected USD 82.17 billion by 2031. The different estimates shouldn't be treated as a single precise forecast. They do show how quickly connected condition monitoring is expanding across asset-intensive industries.
What Industrial IoT Predictive Maintenance Actually Means
Industrial IoT predictive maintenance is a connected operating system for equipment health. It continuously collects condition data, processes that data through analytics, estimates the asset's health, and triggers maintenance activity before a developing fault becomes a functional failure.
A simple medical analogy helps. Vibration, temperature, current, and pressure are equipment vital signs. Edge and cloud analytics act like diagnostic tests that identify patterns a person might miss during a brief inspection. An alert is a referral, not a repair. The maintenance crew remains the specialist that confirms the condition, determines the safe intervention, and returns the asset to service.
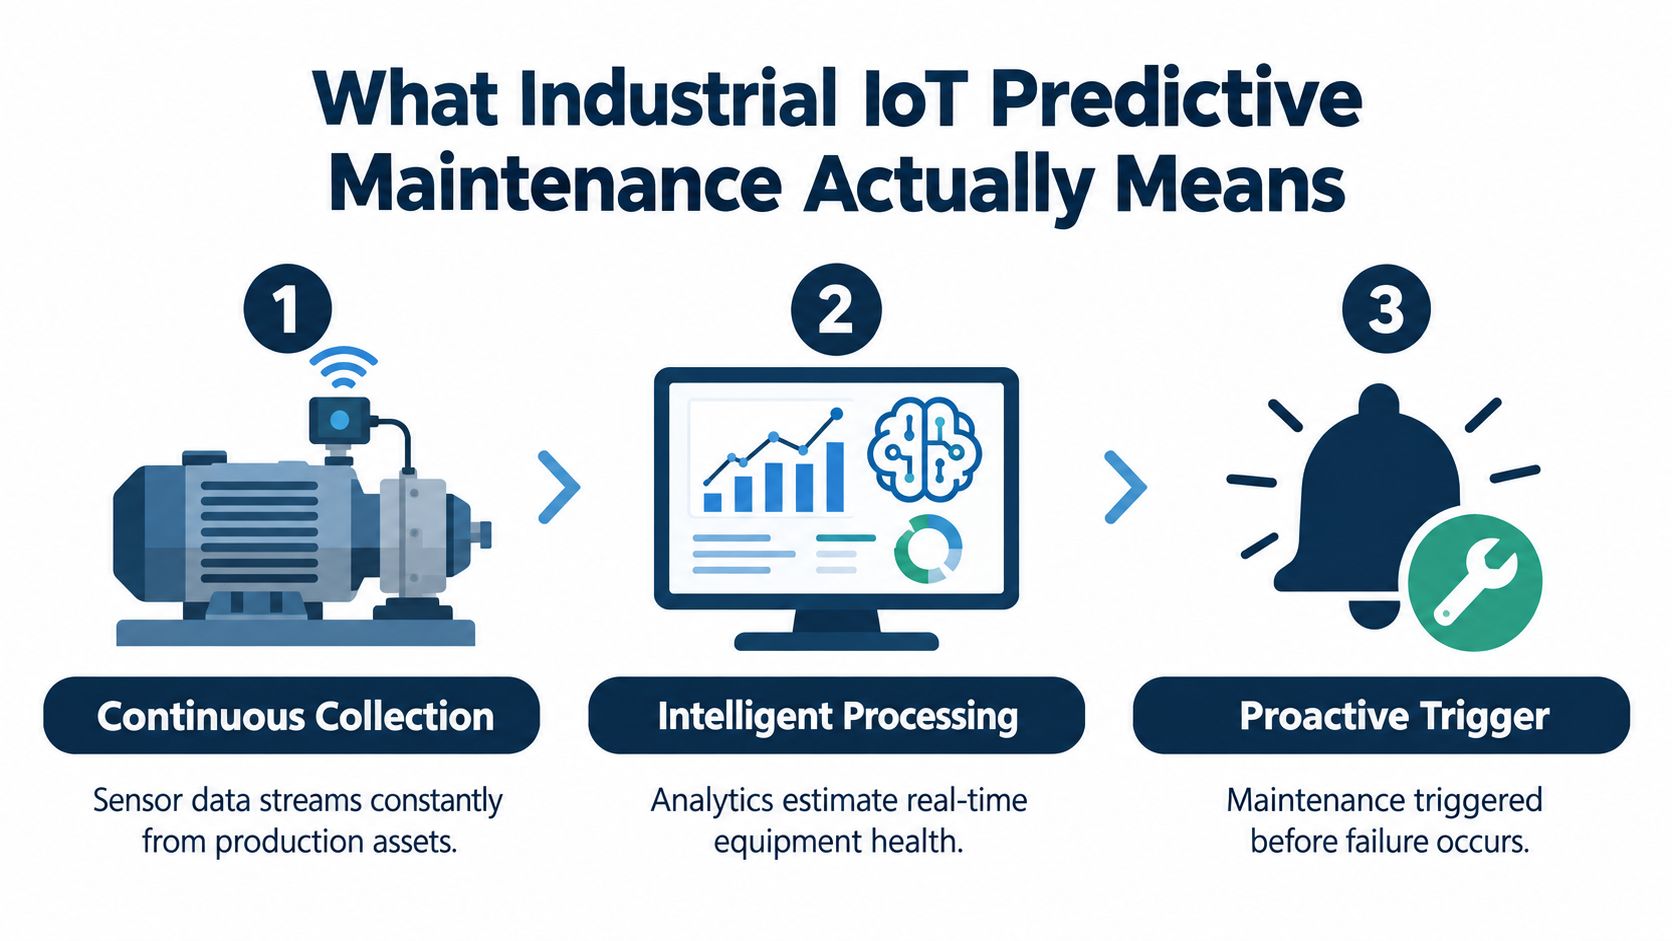
The three decisions behind the label
First, the system needs continuous collection. A technician's route measurement can be valuable, but it provides only a periodic snapshot. A connected stream can reveal when a condition changed, how fast it changed, and whether the change follows load, speed, temperature, or operating mode.
Second, the system needs intelligent processing. Raw sensor values aren't maintenance decisions. The platform must filter noise, identify useful features, compare current behavior with a baseline, and distinguish a genuine anomaly from a normal process change.
Third, the system needs a proactive trigger. The output may be an anomaly alert, a condition score, a likely failure mode, or a remaining-useful-life estimate. The useful output is the one that helps a planner decide what to inspect, what parts to prepare, and when to schedule the work.
Condition monitoring alone may display vibration or temperature values without forecasting degradation or creating a workflow. Predictive maintenance adds interpretation and timing. Prescriptive maintenance goes further by recommending what action should be taken, such as inspection, alignment, lubrication, component replacement, or operating adjustment. Those categories overlap in practice, so a plant should define what its system delivers rather than accepting the label.
Why calendar maintenance isn't enough
Preventive intervals work well when a failure mode has a known age or usage relationship. They work less well when degradation depends on load, contamination, alignment, cooling conditions, switching behavior, or an operating pattern that changes from shift to shift.
The standard architecture follows a layered pipeline of sensor data acquisition, communication, processing and analytics, and application or decision support. The model's output is only as credible as the sensor stream and the failure history behind it. Clean, labeled histories help a model distinguish an early bearing fault from ordinary changes in production duty, while real-time streams allow the system to detect that change soon enough for the crew to act.
The Layered Architecture That Makes It Work
A brownfield deployment shouldn't be treated as a single box labeled “AI.” It is a chain of technical and operational layers. A weakness in any layer can make the final dashboard look polished while producing little maintenance value.
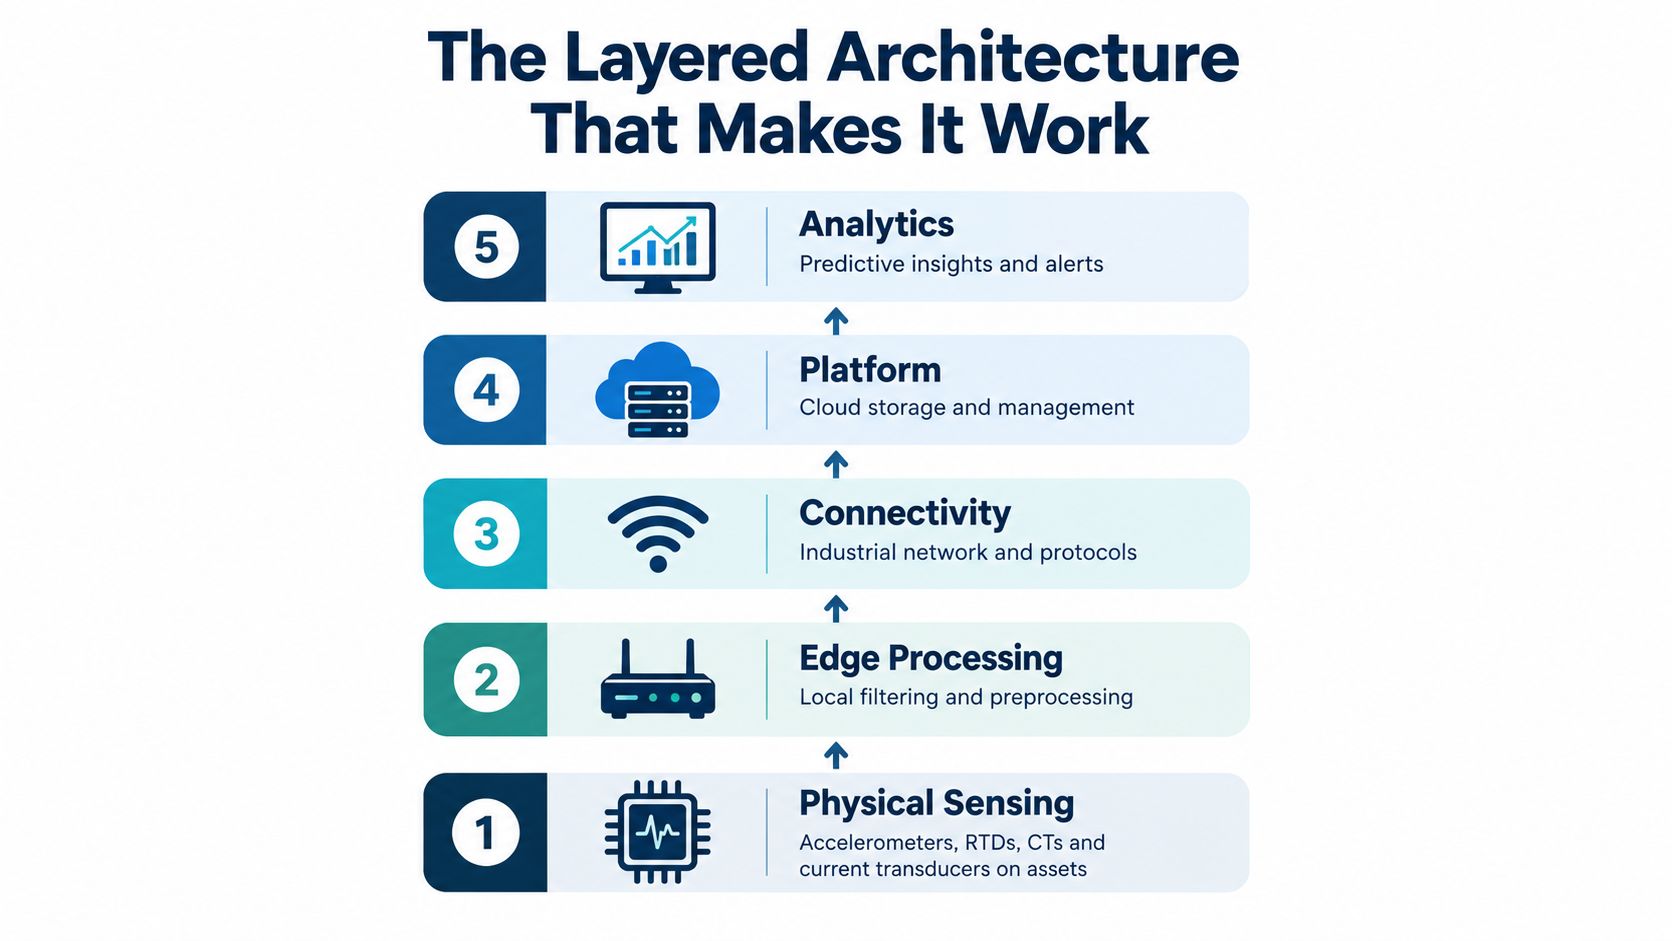
Layer one, physical sensing
Accelerometers capture vibration from motor frames, bearing housings, and driven equipment. RTDs or other temperature sensors monitor winding, bearing, cabinet, or heat-sink conditions. CTs and current transducers capture electrical behavior, while pressure sensors can connect equipment condition to process load. An analog front end conditions the signal before digitization.
The weak point is often installation, not sensor selection. A poorly mounted accelerometer can produce a misleading signal. A temperature sensor placed away from the actual thermal problem may create false reassurance. If the sensor cannot distinguish machine behavior from mounting noise, the analytics layer inherits the error.
Layer two, edge connectivity
The edge layer collects signals close to the equipment and manages local communication. Brownfield sites may need gateways that bridge Modbus TCP, PROFINET, EtherNet/IP, OPC UA, or MQTT-based messaging, depending on the existing control environment.
A weak connection produces gaps, timestamp errors, duplicated values, or an incomplete operating context. Maintenance staff then see an alert without knowing whether the machine was loaded, idling, starting, or changing speed. That missing context can erode confidence quickly.
Layer three, edge analytics
Local compute can filter signals, extract features, perform fast frequency analysis, and identify anomalies without sending every raw waveform upstream. This matters when the plant needs low-latency detection or has limited bandwidth.
The failure mode here is poor configuration. Excessive filtering can remove the early fault signature. Insufficient filtering can create alarm noise. Edge processing must preserve the information needed for deeper analysis while returning a simple health indicator that operators can understand.
Layer four, the platform
A cloud or on-premises platform stores time-series data, manages asset context, supports model training, presents dashboards, and connects with CMMS or EAM systems through APIs. It should relate a signal to the correct asset, location, drive, motor, operating state, and maintenance history.
If integration stops at visualization, the planner still has to copy an alert into a work order. That manual handoff creates delay and loses evidence. A mature design links the condition event to asset records, inspection instructions, parts planning, and the eventual technician finding.
Layer five, decision support
The final layer delivers prioritized alerts, work orders, recommended inspections, and, where justified, remaining-useful-life estimates to the people responsible for action. A technician may receive the alert on a tablet, while a planner sees the priority, history, and suggested work scope.
A prediction has operational value only after someone can verify it, authorize it, and execute it safely.
The industrial IoT monitoring guide provides useful context for connecting equipment visibility with maintenance operations. The architecture should also preserve a human confirmation step. An algorithm can identify an abnormal pattern, but a technician understands access constraints, process risk, recent repairs, and conditions that may not exist in the data.
<iframe width="100%" style="aspect-ratio: 16 / 9;" src="https://www.youtube.com/embed/6GcEQNvMwWk" frameborder="0" allow="autoplay; encrypted-media" allowfullscreen></iframe>From Raw Signal to Remaining Useful Life
A VFD-driven motor produces far more information than a single “healthy” or “failed” status. The challenge is turning a waveform into evidence that a maintenance team can use.
The pipeline often begins with high-frequency vibration or current data. Preprocessing removes noise and corrects signal quality issues. In the time domain, the system may calculate RMS, kurtosis, crest factor, and related indicators. These features summarize energy, impulsiveness, and changes in the signal that may indicate developing mechanical damage.
Frequency-domain analysis adds another view. A fast Fourier transform can separate frequency components, while envelope analysis can help isolate repetitive bearing fault patterns. Three-phase current analysis can reveal electrical imbalance and load-side mechanical symptoms, though the interpretation must account for speed, load, drive behavior, and process conditions.
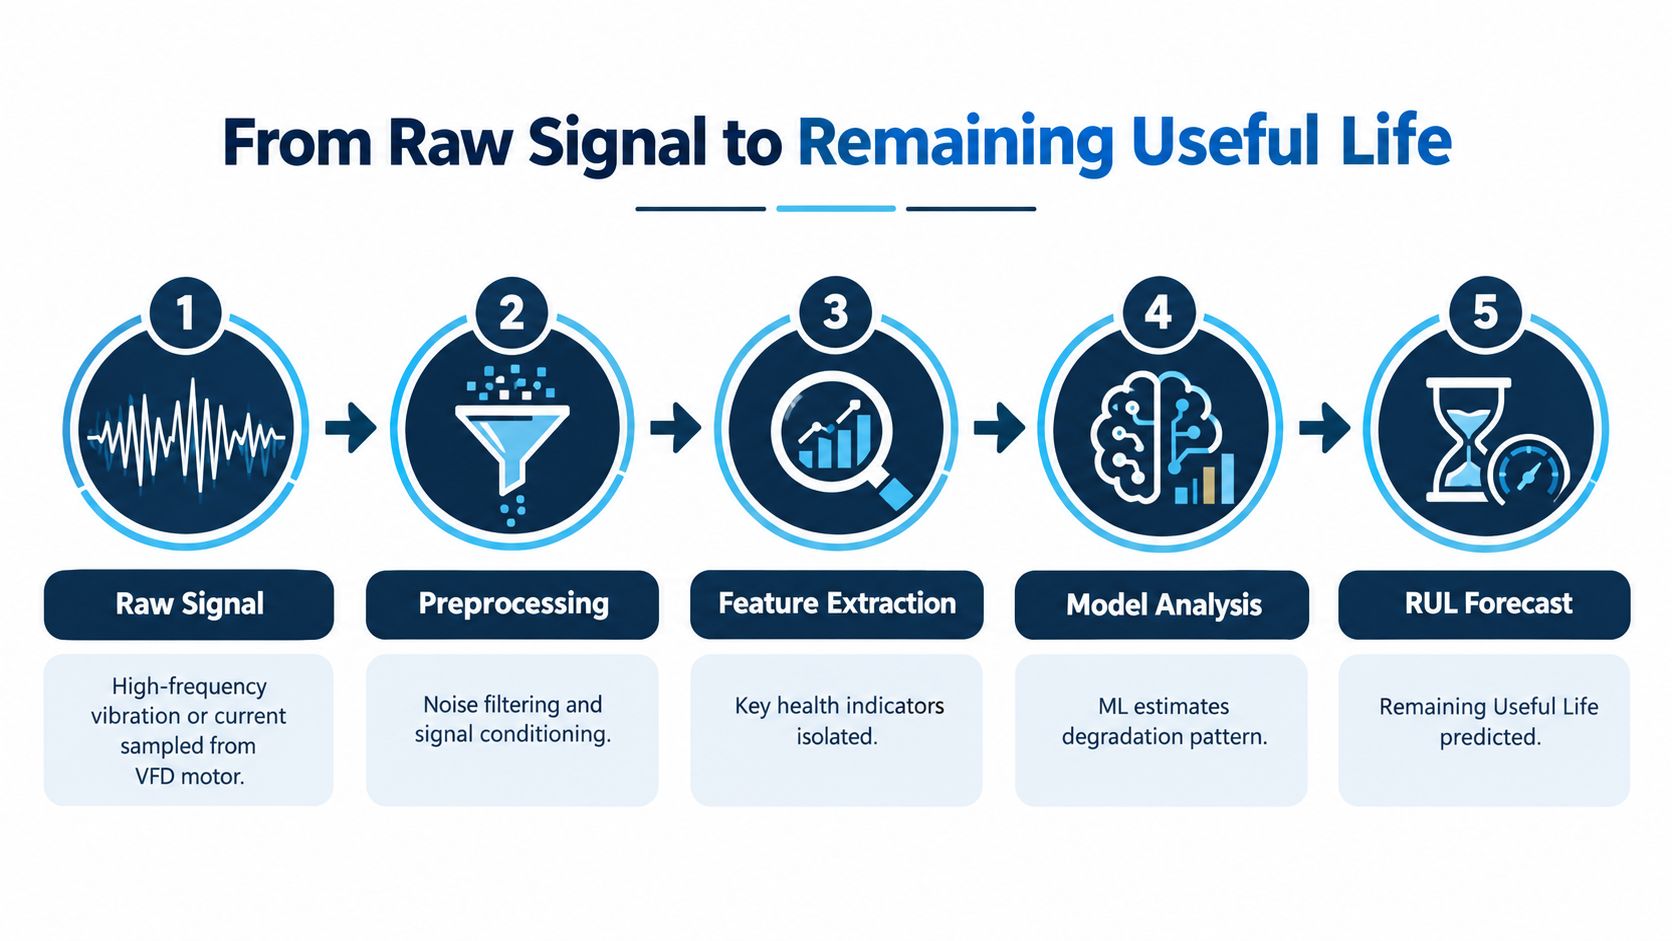
Baselines come before forecasts
A threshold is a useful starting point. If vibration exceeds a known limit, the system can request inspection. A trend is more informative when the asset's normal operating envelope varies. The system can compare current behavior with the same motor under similar speed, load, and temperature conditions.
Machine-learning models extend that comparison. They can learn patterns associated with normal operation and identify deviations that don't fit the baseline. A supervised model needs labeled examples of faults and failures. Many plants have maintenance records, but those records may not identify the exact failure mode, the onset time, or the operating context. That limitation affects model confidence.
The predictive maintenance sensor guide is relevant when deciding which signals can support a useful baseline. Sensor quantity isn't the objective. The objective is a signal that changes a decision.
Turning a forecast into work
Suppose the system estimates that a motor's degradation pattern is consistent with a bearing issue and provides a remaining-useful-life estimate of 14 days. That estimate shouldn't automatically authorize a replacement. The planner should review the trend, confirm the failure mode with inspection, check parts availability, define the isolation procedure, and choose a downtime window.
The resulting work order might include a bearing inspection, vibration verification, alignment checks, required parts, labor roles, and a restart test. After completion, the technician's findings become part of the asset history. That feedback helps the reliability team judge whether the alert was useful and whether the model needs adjustment.
A remaining-useful-life estimate is therefore a planning aid, not a promise. The maintenance team still owns the safety decision and the final repair scope.
Predictive Maintenance Applied to Variable Frequency Drives
VFD systems combine power electronics, control logic, cooling hardware, motors, and mechanical loads. Predictive maintenance has to separate those failure modes rather than treating every abnormal reading as a generic drive problem.
Drive-native diagnostics can expose DC-link voltage, current, temperature, fault history, and operating state, depending on the drive design. Those signals can help identify electrical stress, abnormal loading, and thermal behavior. External sensing adds information the drive may not capture, especially on the motor and load side.
Electrical and thermal signatures
A DC bus capacitor can deteriorate through increased ripple and equivalent series resistance drift. The earliest useful indication may appear as a changing ripple pattern, altered bus behavior, or increasing thermal stress rather than an immediate trip. Input rectifier problems can create abnormal harmonic behavior, while IGBT degradation may present through switching irregularities, thermal changes, or desaturation-related precursors.
Thermal monitoring should cover more than the cabinet air temperature. Heat sinks, embedded power-module sensors, cooling fans, filters, and airflow paths all influence the drive's thermal condition. A fan that is slowing down may not trigger an immediate drive fault, but it can reduce cooling margin and accelerate aging.
Mechanical symptoms through electrical data
The drive can sometimes reveal load-side problems through current signature analysis. Misalignment, bearing wear, mechanical looseness, and torque disturbance can modulate the motor current, particularly when the operating state provides enough signal separation.
Low-speed operation complicates the analysis. If a VFD runs below the minimum switching or operating frequency expected by the monitoring method, fault frequencies may be masked or distorted. The analyst needs speed and load context before interpreting a current or vibration change.
| Failure Mode | Physical Indicator | Detection Method | Earliest Signal |
|---|---|---|---|
| DC bus capacitor aging | Increased ripple and thermal stress | DC-link trend analysis and electrical inspection | A changing ripple pattern under comparable load |
| Input rectifier degradation | Abnormal input current behavior | Current and harmonic analysis | Persistent phase-related deviation |
| IGBT stress | Switching irregularity or thermal change | Drive diagnostics, power-module temperature, and event history | Repeated abnormal switching or rising thermal response |
| Cooling-fan degradation | Reduced airflow and higher heat-sink temperature | Fan condition checks and thermal trending | Temperature rise under a familiar duty cycle |
| Motor bearing wear | Vibration, torque variation, or current modulation | External vibration sensing and current signature analysis | A developing trend tied to speed or load |
| Shaft misalignment | Periodic vibration and changing torque demand | Vibration spectrum, current analysis, and alignment inspection | A repeatable pattern during steady operation |
The distinction between native and external monitoring matters. Native diagnostics are efficient for drive internals, but they may not identify a bearing fault with enough certainty. External sensors can see the motor and mechanical train, yet they add mounting, calibration, connectivity, and maintenance obligations. A practical system combines both where the asset's criticality justifies it.
Where the Real ROI Comes From and Where It Disappears
The first return usually comes from assets where a failure disrupts production, creates difficult recovery work, or threatens adjacent equipment. A secondary pump, fan, compressor, or conveyor drive may be more suitable than a primary asset that already receives a full planned overhaul before degradation can create additional value.
Stable operating patterns help because the system can establish a clearer baseline. A motor that runs at consistent speed and load is easier to compare than one that changes duty constantly. The maintenance team also needs enough authority and capacity to act. An accurate alert that waits in an unassigned queue won't produce savings.
The hidden cost of a brownfield deployment
A project can lose its business case through several predictable paths:
- Alarm overload: Frequent low-value alerts train operators to dismiss notifications.
- Weak context: A signal without speed, load, process state, or maintenance history leads to uncertain diagnosis.
- Disconnected execution: An alert that doesn't create or update a work order leaves the planner with manual administration.
- Unclear ownership: No one is responsible for validating alerts, improving thresholds, or reviewing model drift.
- Over-monitoring: The plant instruments equipment that is already replaced on a fixed schedule, leaving little avoidable risk.
Independent and peer-reviewed work continues to identify interoperability gaps, scattered standards, cybersecurity exposure, noisy or missing data, and difficulty connecting predictions to CMMS execution as barriers. The same research notes that many deployments need 6 to 12 months of baseline data before model performance becomes dependable, and that model maintenance, drift detection, software updates, and human-AI collaboration remain underdeveloped areas. These observations are summarized in the research on predictive-stack lifecycle management.
A plant should therefore calculate more than avoided downtime. Include sensor installation, network work, data contextualization, labeling, technician training, integration, retraining, and ongoing alarm review. The platform becomes financially useful when it prevents a credible failure or improves planned work, not when it produces a large number of dashboards.
ROI test: If the team can't state who receives an alert, what they verify, and which work order follows, the deployment isn't ready to scale.
A Practical Checklist for Getting Started
Start with one critical asset and one failure mode. A VFD-driven pump or fan with a known history of trips, bearing problems, thermal stress, or capacitor aging provides a more useful pilot than a broad installation with no defined decision.
Before collecting data, confirm the basics:
- Instrument correctly: Verify sensor mounting, measurement range, calibration, sampling behavior, and exposure to heat, dust, vibration, or contamination.
- Capture a baseline: Plan a baseline window of at least 30 days across the normal operating states the asset experiences.
- Record context: Connect speed, load, process state, alarms, inspections, repairs, and operating changes to the time-series record.
- Test the alarm: Review false positives with operators and technicians before treating an alert as a maintenance trigger.
- Create the workflow: Define how an alert becomes an inspection, a planned work order, a parts request, or an escalation.
- Assign ownership: Name an analytics owner, a reliability champion, and a frontline operator who verifies whether alerts match field conditions.
- Review the model: Schedule a quarterly review of thresholds, drift, maintenance findings, and changes in asset operation.
The pilot should measure decision quality, not only prediction accuracy. Ask whether the team had enough warning, whether the failure mode was correctly identified, whether the work scope was practical, and whether the technician's finding was recorded for future learning.
The technology will evolve, but the operating discipline determines whether the program survives. Trust grows when alerts are explainable, responsibilities are clear, and technicians see their knowledge improving the system rather than being replaced by it.
DUCHENG Industrial supports VFD lifecycle work from commissioning and troubleshooting through preventive care, repair, on-site reconditioning, spare-parts verification, and Smart O&M or IoT consulting for monitoring and integration decisions. If your brownfield drive systems need a practical condition-monitoring plan connected to real maintenance workflows, visit DUCHENG Industrial to discuss the next asset and the right starting point.