
Understand how an iot remote monitoring system connects VFD fleets to SCADA, cuts downtime, and protects assets with real examples and secure architecture.
A successful IoT remote monitoring system for VFD fleets combines edge buffering, protocol-aware telemetry, and OT segmentation so operators get early warnings without widening their attack surface. The remote monitoring and control market was estimated at USD 23.868 billion in 2024 and is projected to reach USD 32.835 billion by 2030, with a 5.6% CAGR from 2025 to 2030 (Grand View Research market estimate).
A maintenance manager knows the scene. A drive trips during a critical production window, the operator resets it under pressure, and the original fault evidence disappears before anyone can diagnose the cause. The plant gets running again, but the same cabinet may already be carrying the next failure.
For a small installation, a fault relay and a local screen may be enough. A multi-brand fleet spread across production lines, substations, pumps, fans, and compressors needs more. It needs a reliable way to collect condition data, preserve events, separate fast local control from slower remote decisions, and deliver useful information to the people responsible for uptime.
An IoT remote monitoring system isn't just a cloud dashboard connected to every drive. It is an operating architecture that joins sensors, VFD parameters, gateways, SCADA, maintenance records, secure access, and engineering judgment. The design succeeds when a warning changes what the plant does next.
Table of Contents
- Why VFD Fleet Monitoring Demands an IoT Remote Monitoring System
- IoT Remote Monitoring Architecture for Industrial VFD Fleets
- Data Arrangements and Protocol Choices That Matter for Drive Monitoring
- Integrating IoT Monitoring With SCADA And Customer Portals
- Security, Connectivity Options, And Operational Risk Management
- ROI And Failure-Prediction Use Cases For Drive Fleets
- Implementation And Deployment Considerations For IoT Remote Monitoring
- Next Steps For VFD Operators Considering Iot Remote Monitoring
Why VFD Fleet Monitoring Demands an IoT Remote Monitoring System
A drive trips during a production run. The operator resets it, the line restarts, and the evidence behind the fault begins to disappear. The cabinet may continue operating, but a weakened cooling fan, restricted airflow, abnormal motor current, or a process change can remain unresolved.
A basic alarm confirms that a value crossed a limit. It rarely shows the sequence that produced the trip. During restart, that difference affects the decision. An overtemperature alarm may lead to a quick inspection and reset. Retained temperature trends, current behavior, fan status, fault history, and operating context let the engineer ask a more useful question: what changed before the trip?
From isolated alarms to fleet awareness
Industrial remote monitoring developed from alarm and telemetry arrangements built around Remote Terminal Units, or RTUs, in utilities such as electric grids and wastewater plants. Early systems often used telephone lines or local networks to signal failures and overheating. Modern IoT arrangements add sensors, wider connectivity, historical records, diagnostics, and remote decision support, as described in this history of industrial IoT remote monitoring.
A VFD fleet creates a harder integration problem. Different manufacturers expose fault codes through different registers, fieldbus objects, or proprietary interfaces. One drive may provide detailed thermal information, while another offers only basic status data. The control room receives fragmented alarms, and maintenance teams often keep separate notes. Patterns that span brands, lines, and sites stay hidden unless the monitoring design normalizes the information.
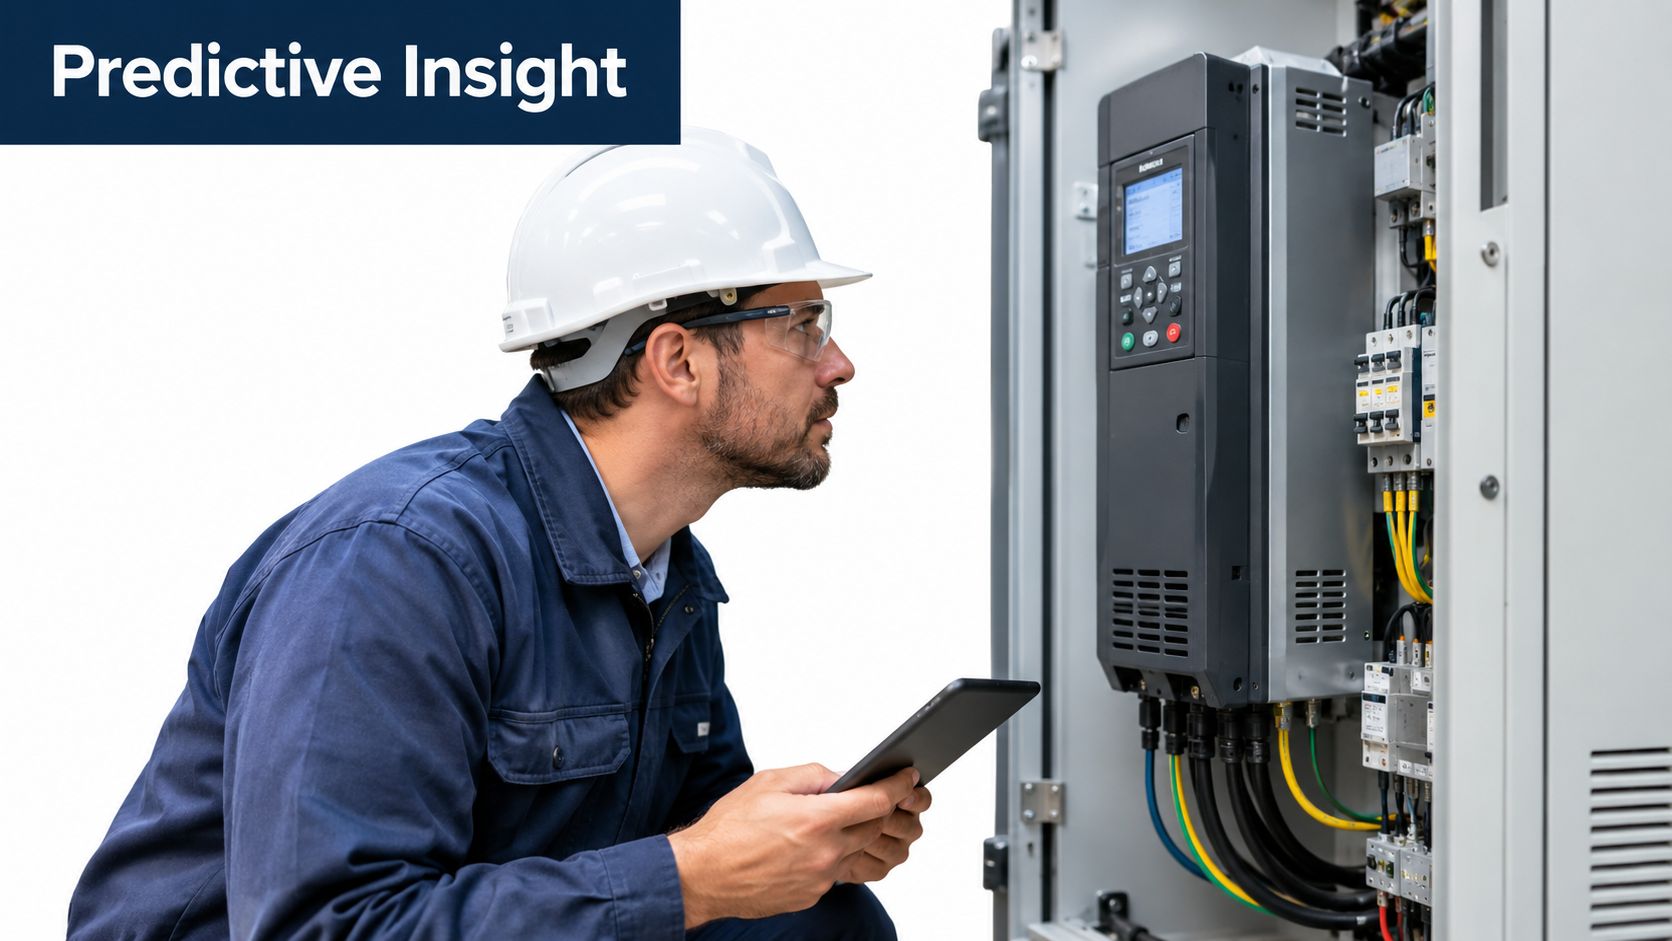
DUCHENG-style Smart O&M consulting addresses that gap by working across multi-brand VFD fleets, legacy SCADA, and controlled remote access. The practical goal is not to move every control function into a cloud dashboard. Local OT protection and fast control remain local, while remote visibility gives engineers the evidence needed for slower diagnosis, maintenance planning, and escalation.
What the system should change
A useful monitoring program should help a plant team:
- Preserve evidence: Store conditions before, during, and after a trip instead of relying on a reset button or handwritten notes.
- Prioritize attention: Separate a critical drive warning from routine status traffic.
- Compare like conditions: Review current, temperature, loading, and fault behavior against the same drive's previous operation.
- Coordinate response: Give operators, electrical engineers, and service personnel a shared record.
- Support lifecycle work: Connect early warnings with preventive care, repair, reconditioning, spare-part review, and controlled restart procedures.
Remote monitoring does not replace local inspection or diagnostic discipline. It improves the timing and quality of those activities. Its value comes from helping teams reduce avoidable downtime, organize maintenance work, and make safer restart decisions, as reflected in this market context for remote monitoring and control.
Practical rule: If an alarm does not lead to a defined inspection, decision, or maintenance action, it probably does not belong in the first layer of the monitoring design.
IoT Remote Monitoring Architecture for Industrial VFD Fleets
A plant can have every drive visible on one dashboard and still lose control of the operation if the architecture sends fast decisions through a distant service. A practical design keeps protection and response local, while it sends selected evidence to plant systems or a cloud service for diagnosis, maintenance planning, and multi-site review. The edge captures and protects local evidence. The gateway aggregates and translates it. The plant or cloud service stores, analyzes, and routes the information.
At the edge, signals come from the VFD and from cabinet or process sensors. They may include drive state, speed reference, output current, DC bus behavior, heatsink temperature, fault codes, fan status, motor temperature, vibration, humidity, and door or filter condition. The right set depends on the drive, process, and failure modes the maintenance team needs to identify. A multi-brand fleet also needs asset identity and operating context, otherwise similar tags become difficult to compare across different drive families.
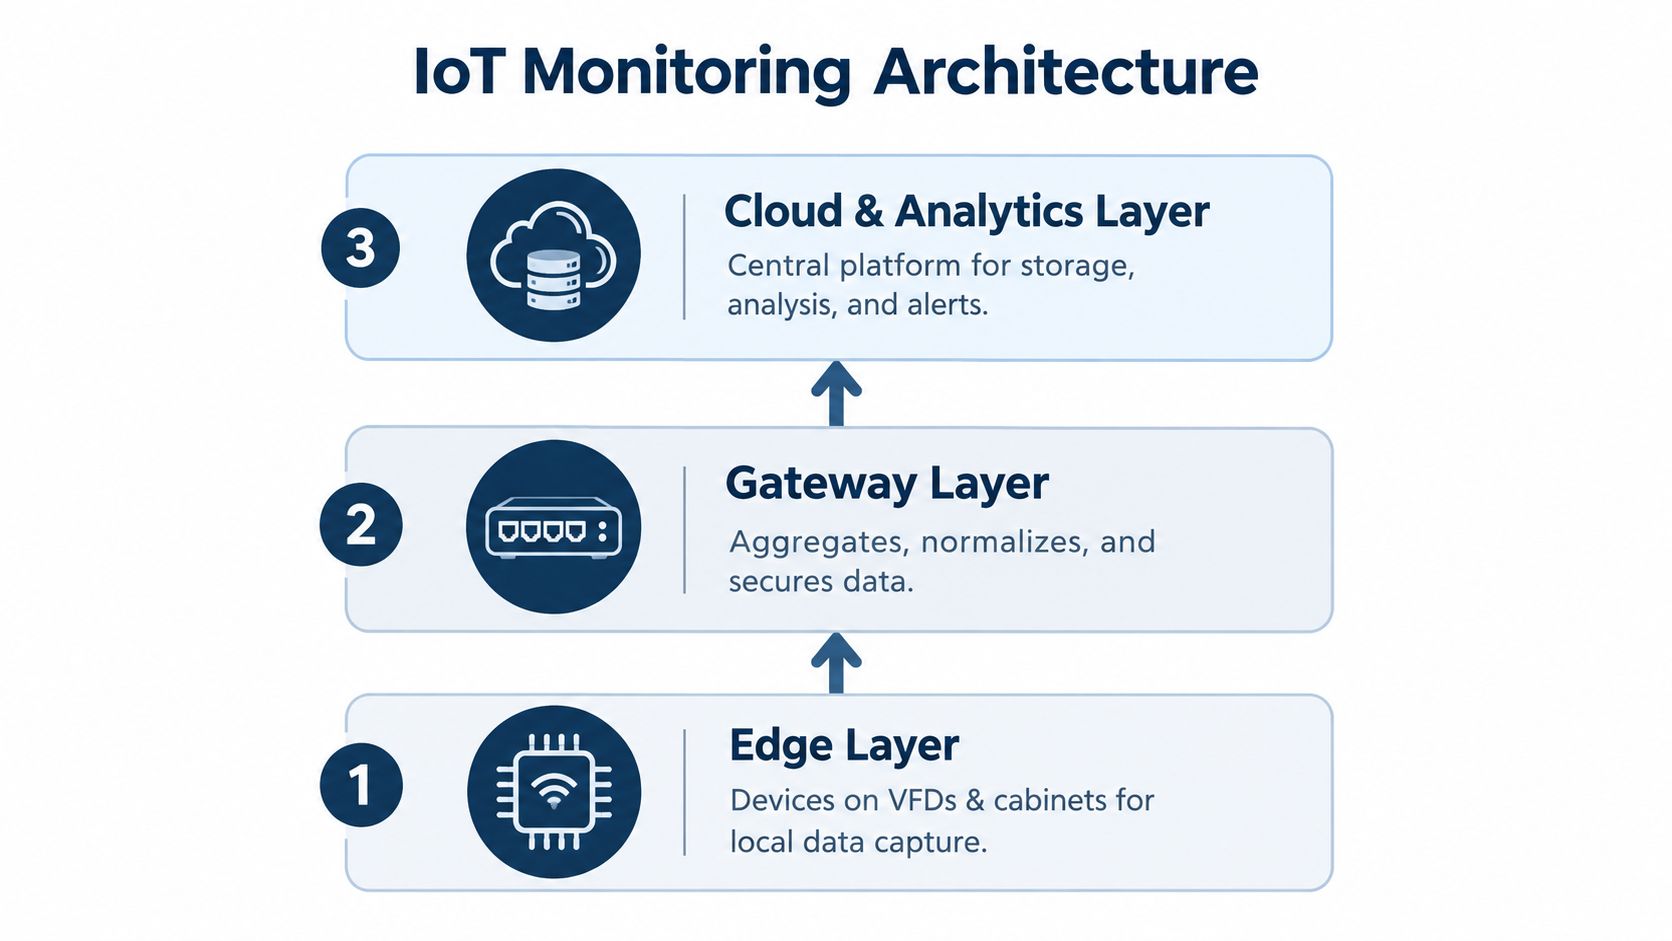
Edge layer
The edge device must continue collecting important information when the uplink fails. Local buffering preserves the sequence around a trip. Local validation can reject impossible readings, mark stale values, and apply simple thresholds before data leaves the cabinet.
Local control stays inside the plant control architecture. Drive protection, interlocks, emergency functions, and rapid process response cannot depend on a remote connection. Remote monitoring supports engineering decisions, but it should not be placed in the path that protects a motor or stops unsafe equipment.
Industrial cabinets also create measurement problems that office networks do not. Switching noise, harmonics, heat, dust, vibration, and mixed signal types can distort readings or shorten hardware life. Sensor placement, shielding, grounding, and signal conditioning require the same attention as the dashboard.
Gateway layer
The gateway gives a mixed-brand fleet a shared operational structure. It can poll legacy registers, receive event messages, normalize units, attach asset identifiers, filter repetitive values, and forward selected records to historians, alerts, and analytics. This layer is often the practical bridge between older SCADA installations and newer remote services.
Filtering becomes more important as sensor volume grows. A manufacturing latency benchmark found transmission delay increased from 1.91 ms at 100 records per second to 291.64 ms at 2,000 records per second, while throughput remained unsaturated (industrial IoT latency benchmark). The practical conclusion is straightforward: protect alarm traffic, buffer events at the edge, and give messages different priorities instead of sending every value with equal urgency.
Cloud and analytics layer
The upper layer can provide long-term storage, trend views, event correlation, role-based access, alert routing, and links to maintenance workflows. Cloud storage helps compare sites, but a plant historian may remain the better destination for control-room records or facilities with strict connectivity limits.
A hybrid design records locally and publishes selectively. Secure remote access should expose the evidence engineers need without transferring operational authority away from the equipment. DUCHENG's industrial IoT monitoring guidance provides a practical reference for connecting multi-brand drives, legacy SCADA, and remote service workflows without treating a cloud dashboard as the control system.
<iframe width="100%" style="aspect-ratio: 16 / 9;" src="https://www.youtube.com/embed/KeaeuUcw02Q" frameborder="0" allow="autoplay; encrypted-media" allowfullscreen></iframe>Data Arrangements and Protocol Choices That Matter for Drive Monitoring
A drive fleet can generate more data than a maintenance team can review. A trip, a thermal trend, and a local control signal require different timing, reliability, and retention rules. Sending all three through the same path adds network load and can bury the events that need immediate attention.
Organize telemetry by operational purpose:
- Alarm-critical data covers trips, protection states, communication failures, and abnormal temperature conditions. The edge gateway should retain each event with its timestamp, asset identity, operating state, and available pre-event context.
- Condition data covers current, temperature, vibration, humidity, fan status, and load trends. Sample and aggregate these values according to the suspected failure mode instead of publishing every raw reading indefinitely.
- Diagnostic records include fault histories, parameter snapshots, service notes, and restart outcomes. Keep them searchable with the asset's maintenance history so a technician can connect a warning to previous work.
MQTT, CoAP, and HTTP have different jobs
A comparative benchmark reported 100% packet delivery for MQTT across its tested scenarios. It also recorded CoAP at 0.55 ms average latency, compared with MQTT at 0.81 ms and HTTP at 525.40 ms, while CoAP produced the strongest throughput and the lowest tested CPU utilization, at 8.5% (MQTT, CoAP, and HTTP performance evaluation).
These results help frame transport choices, but they do not replace site testing. MQTT fits persistent telemetry from dispersed drives because its message model supports ongoing status and health reporting. CoAP can suit constrained endpoints where overhead and latency are tightly limited. HTTP remains useful for application interfaces and service integrations, while its request pattern is usually a poor default for dense, continuous drive telemetry.
A remote protocol should not close a fast VFD control loop. Network delay varies, packets queue, and gateways can stop responding. Control fidelity stays local. Monitoring protocols carry observation, event reporting, and carefully governed commands. This division preserves local OT control while giving an IoT remote monitoring system broader fleet visibility.
Design the traffic before selecting the transport
For a cabinet contamination project, humidity and temperature may be sampled periodically, while a sudden fan failure should create an immediate event. For a medium-voltage drive, a fault log and parameter snapshot may provide more maintenance value than an uninterrupted stream of every internal value. Define retention, priority, timestamps, and offline behavior before choosing the message path.
Legacy serial equipment still belongs in the design. A clear RS-485 RTU Modbus integration approach can preserve existing data while a gateway converts it into a normalized model. That model should identify the asset, signal, unit, quality state, timestamp, and source protocol.
DUCHENG-style Smart O&M consulting uses this boundary to connect multi-brand VFD fleets and older SCADA systems without moving control authority into a cloud dashboard. Secure remote access can expose the evidence needed for diagnosis, while local equipment continues to protect the process when connectivity fails.
Integrating IoT Monitoring With SCADA And Customer Portals
A plant can have a capable SCADA system and still lose maintenance context between sites, shifts, and service teams. Adding another dashboard does not solve that gap by itself. Integration works when one drive event can reach the control room, create a service record, and support cross-site review without manual transcription.
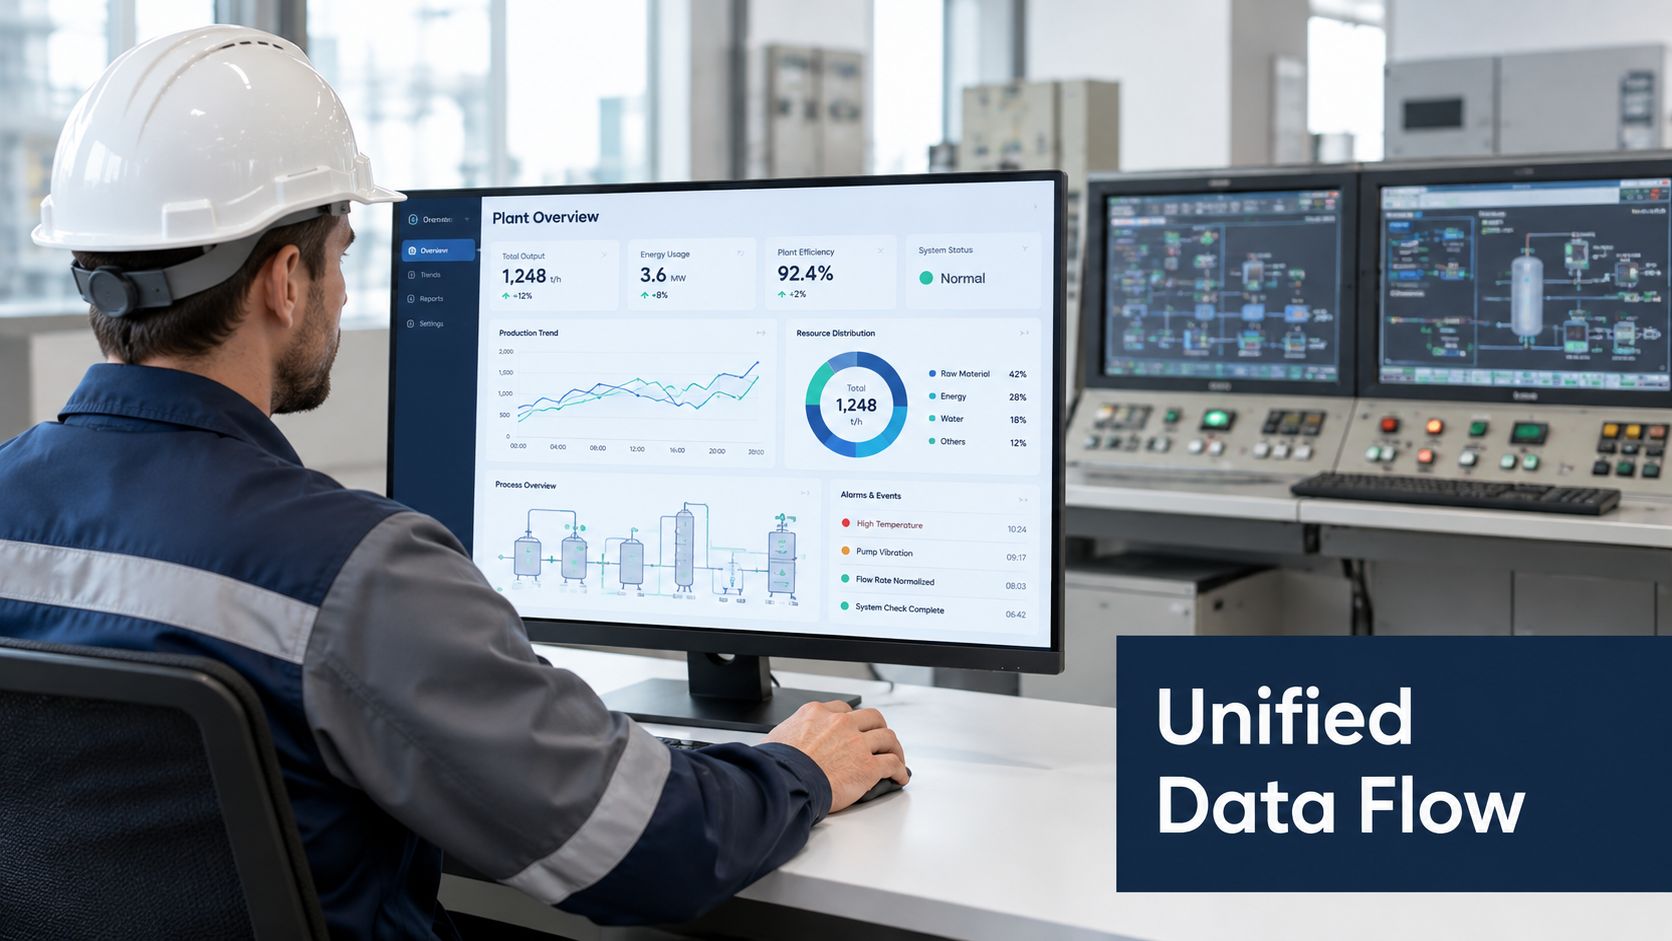
SCADA remains responsible for operator awareness and plant control. The IoT layer adds historical context, fleet comparison, remote condition visibility, and structured service data. A customer portal can expose approved records, request initiation, work status, diagnostic findings, and repair documentation, while keeping direct access to the control network restricted.
Build a common asset model
Multi-brand fleets become manageable when integration follows plant decisions rather than manufacturer-specific screens. Operators need to know whether a drive is running, whether thermal margin is changing, which fault occurred, what preceded it, and what action followed.
A normalized model should retain source detail while presenting consistent fields:
- Asset identity: Site, line, cabinet, drive rating, motor, and process duty.
- Operating state: Running, stopped, faulted, bypassed, unavailable, or under maintenance.
- Condition values: Current, temperature, vibration, humidity, loading, and relevant auxiliary states.
- Event context: Timestamp, fault code, preceding trend, operator action, and restart result.
- Service status: Open request, assigned engineer, inspection outcome, repair scope, and follow-up requirement.
The model lets teams recognize recurring failure patterns even when manufacturers use different signal names. It also supports fault isolation. A drive alarm may originate from the motor, load, cooling system, power quality, or process rather than the drive itself.
Connect insight to action
A control-room alarm needs a defined escalation path. Maintenance staff should be able to review supporting evidence, request an inspection, and attach findings to the same asset record. The service provider should see approved history before arriving, instead of relying on an unverified trip description.
DUCHENG Industrial's Smart O&M and customer-portal approach links monitoring architecture with request initiation, service records, field activity, workshop work, and tracking. The practical benefit is less ambiguity between what the drive reported, what the plant observed, and what the maintenance team did. This approach can bridge multi-brand VFD fleets and legacy SCADA while keeping control authority local. Remote access then provides diagnostic evidence without treating a cloud dashboard as a replacement for plant control.
Security, Connectivity Options, And Operational Risk Management
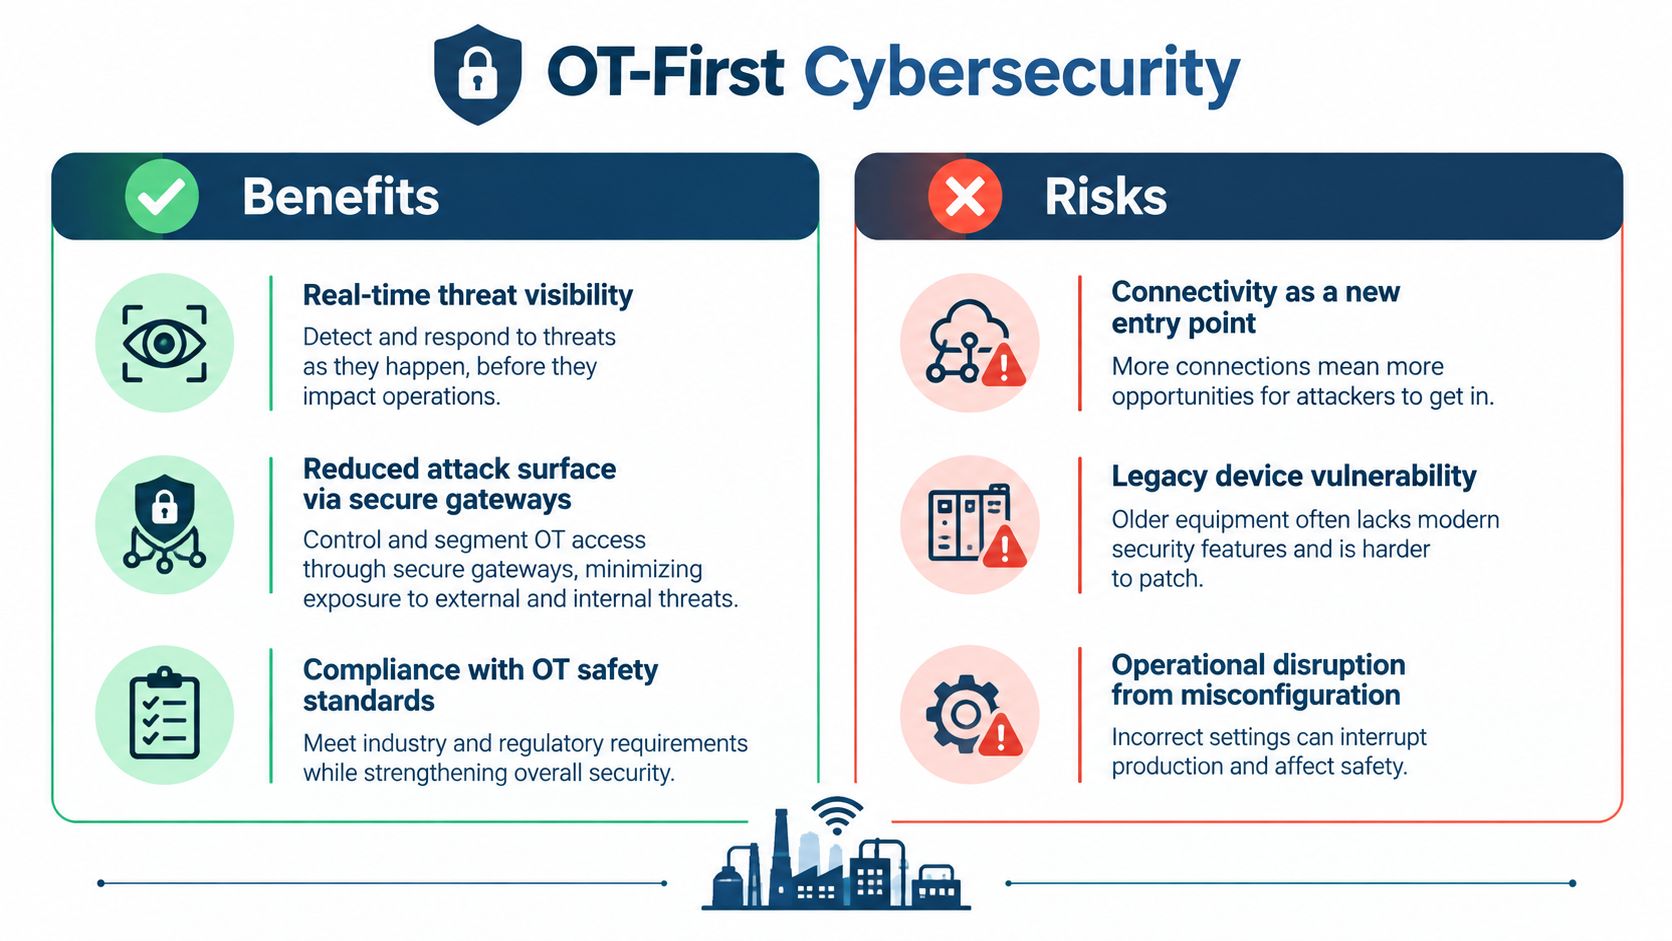
A remote connection can cut an unnecessary site visit, then introduce a new route into the plant network. VFD fleets make that trade-off harder because older drives may not support endpoint agents, frequent patching, or current authentication methods. The monitoring design must preserve local OT control while giving service engineers enough evidence to diagnose faults.
OT security findings and access-control guidance highlights unauthorized external access as a recurring industrial risk and notes that advanced controls, including session recording and OT-aware authentication, remain limited. For a drive fleet, the practical response is controlled access rather than a broad connection to every device.
Visibility must follow segmentation
Separate drive control, monitoring, and remote service access. Place a gateway between the drive network and enterprise or external connections. Define narrow data flows, block unnecessary inbound routes, and keep command authority inside the plant. Passive traffic monitoring can identify unusual access without installing software on equipment that was never designed to host it.
Wireless connectivity needs the same discipline. A weak signal can leave assets unseen, while an improvised connection may bypass segmentation applied to wired networks. Choose the link according to physical conditions, outage tolerance, maintenance capability, and site policy, not signal availability alone.
DUCHENG Industrial's Smart O&M consulting can bridge multi-brand VFD fleets, legacy SCADA, and secure remote access through this separation. A cloud dashboard may improve fleet visibility, but it should not replace local interlocks, operator authority, or deterministic control. Remote users should receive diagnostic data and approved service functions, with latency and connection loss treated as operating conditions.
OT-first principle: Give remote users only the visibility and control required for their task, then record approved sessions and changes that could affect equipment behavior.
Govern access as an operational function
Define who can view trends, acknowledge alarms, change configuration, and initiate service work. Authentication, role separation, session recording, time-limited permissions, and approval workflows matter more than a polished portal.
Patch planning also needs an OT process. Test changes, schedule them around production constraints, preserve rollback options, and document affected assets. A system that improves visibility while allowing uncontrolled remote writes has exchanged one operational risk for another.
ROI And Failure-Prediction Use Cases For Drive Fleets
Monitoring earns its place when it changes maintenance timing or improves a recovery decision. A dashboard that only confirms a drive is running may be useful, but it doesn't justify a complex architecture by itself. The stronger business case comes from connecting condition evidence to avoided disruption, better repair scope, and more disciplined use of specialist support.
Consider a drive that repeatedly trips during a production window. Without preserved history, the team may replace a part, restart, and wait for the next event. With trend data and event context, the engineer can determine whether the fault followed rising temperature, abnormal loading, cooling degradation, communication loss, or a process disturbance.
Use cases that produce operational value
Early thermal warning can trigger cabinet inspection before heat-driven aging becomes a trip. The response might include cleaning, fan replacement, airflow verification, or a shutdown inspection rather than an emergency repair.
Contamination tracking can combine humidity, temperature, filter condition, and visual inspection records. This is especially relevant where dust, salinity, or conductive contamination can affect cooling and insulation.
Failure-pattern recognition helps separate recurring fleet issues from isolated component failures. If similar drives report comparable symptoms under similar duties, the plant can review installation, environment, parameters, power quality, and maintenance practice instead of repeatedly swapping parts.
Controlled restart support gives the team a structured basis for deciding whether a restart is acceptable, what checks must be completed first, and what conditions require escalation. Monitoring doesn't authorize a restart on its own. It improves the evidence available to the responsible engineer.
Measure decision quality, not dashboard activity
Useful measures include avoided emergency shipping, improved spare-part matching, shorter fault-isolation time, better planned shutdown work, and clearer evidence for repair versus replacement. For medium- and high-voltage drives, avoiding unnecessary transport can also reduce handling risk when an on-site assessment or reconditioning path is practical.
Prediction requires restraint. A trend model can identify deterioration and raise an engineering review. It cannot prove the exact failed component unless the data and diagnostic tests support that conclusion. Maintenance teams should record whether each warning led to an inspection, a confirmed defect, a false alarm, or no action, then refine thresholds and data selection.
Decision test: If the alert doesn't change when you inspect, repair, stock, or restart an asset, it isn't yet a maintenance signal. It's just telemetry.
Implementation And Deployment Considerations For IoT Remote Monitoring
A plant can have a polished remote dashboard and still lack usable evidence during a drive trip. Deployment should therefore begin with the site, not the platform. Document the VFD fleet, existing SCADA paths, network segments, legacy protocols, cabinet conditions, maintenance ownership, and the consequences of lost communications. A custom architecture may fail at a large site if connectivity is limited or no team can maintain the integration.
The industrial IoT monitoring integration considerations point to a practical constraint: multi-brand equipment and restricted plant networks make custom monitoring difficult. The build-versus-integrate choice should follow operating capability, cybersecurity boundaries, and support responsibility, rather than dashboard features alone. DUCHENG-style Smart O&M consulting can help connect mixed-brand drives with legacy SCADA while keeping fast control local and remote access governed.
A phased deployment sequence
- Select a representative pilot. Choose a critical drive with a known maintenance concern, but avoid an unusual asset whose integration cannot be repeated elsewhere.
- Define the data contract. Agree on asset names, units, timestamps, quality flags, event priorities, retention, and offline behavior before commissioning.
- Map the signal path. Record where each value originates, how the gateway reads it, where it is stored, and which role receives the alert.
- Test failure behavior. Disconnect the uplink, generate approved test events, verify local buffering, confirm alarm priority, and check that SCADA remains safe and functional.
- Review the workflow. Ask operators and maintenance personnel whether an alert provides enough context for an inspection or service request.
- Scale by risk and repeatability. Add drives only when their data model and maintenance response can be supported consistently across the site.
Readiness checklist
- Network capacity: Can prioritized telemetry share the plant network without affecting control traffic?
- Asset information: Are drive, motor, cabinet, process, and spare-part identities consistent?
- Sensor plan: Does each added sensor address a known failure mode?
- Integration ownership: Is one team responsible for gateway configuration, data quality, and access review?
- Maintenance response: Does every alert have an owner and an expected action?
- Cybersecurity approval: Are segmentation, authentication, remote sessions, and change control documented?
- Training: Can operators distinguish a warning, trip, communication fault, and maintenance condition?
Test the design with the uplink unavailable, because local control must continue even when centralized visibility does not. Edge buffering preserves evidence for later review, but it cannot repair poor timestamps, unclear asset identities, or an undefined response process.
A phased rollout exposes integration debt while the affected asset population remains manageable. It also limits the common failure of collecting more data than the plant can interpret, secure, and maintain.
Next Steps For VFD Operators Considering Iot Remote Monitoring
Start with the last serious drive trip, not with a software demonstration. Ask what evidence survived, which signals were missing, how long fault isolation took, whether the spare part was correctly matched, and what information the next engineer would need before arriving on site.
Then classify the fleet by criticality, age, brand, environment, connectivity, and failure history. Select a pilot that can demonstrate a real maintenance decision, such as a thermal inspection, a controlled restart, a recurring-fault review, or a planned reconditioning assessment.
A sound design keeps fast control local, uses edge buffering for evidence, applies protocol choices to the data's actual purpose, and places remote access behind OT segmentation and access governance. It also connects monitoring to SCADA, service records, and customer-facing workflows instead of creating a parallel data silo.
Smart O&M consulting adds value when the plant has multiple drive brands, incomplete documentation, legacy networks, uncertain cybersecurity boundaries, or no agreement on who owns the response to an alert. The right outcome isn't maximum connectivity. It's secure, interpretable information that improves commissioning, preventive care, rapid restore, and late-life VFD decisions.
DUCHENG Industrial provides multi-brand VFD commissioning, troubleshooting, preventive care, repair, on-site reconditioning, and Smart O&M consulting for monitoring architectures and data integration. Review your fleet's monitoring gaps and discuss a practical, secure architecture with DUCHENG Industrial.