
Learn how motor current signature analysis detects bearing, rotor and air-gap faults in VFD-driven motors, which instruments to use, and how to read results.
The pump drive has tripped again. Your electrician has saved the fault code, operations wants a restart, and someone has flagged a peak beside the main current-frequency component. Is it a damaged rotor, a supply problem, or the inverter doing what its settings tell it to do?
Motor current signature analysis (MCSA) can help you narrow that decision without dismantling the motor. But on a variable frequency drive (VFD), a suspicious spectrum isn't a diagnosis. The useful question is whether a repeatable current feature follows motor physics, inverter behavior, or a change in the process.
Table of Contents
- What Motor Current Signature Analysis Actually Measures
- Fault Signatures Hidden in the Current Spectrum
- How to Take a Clean Current Measurement
- Reading Spectra on VFD-Driven Motors
- How Reliable MCSA Results Are
- Where MCSA Pays Off in Industrial Plants
- Set a Baseline Before You Act on an Alarm
What Motor Current Signature Analysis Actually Measures
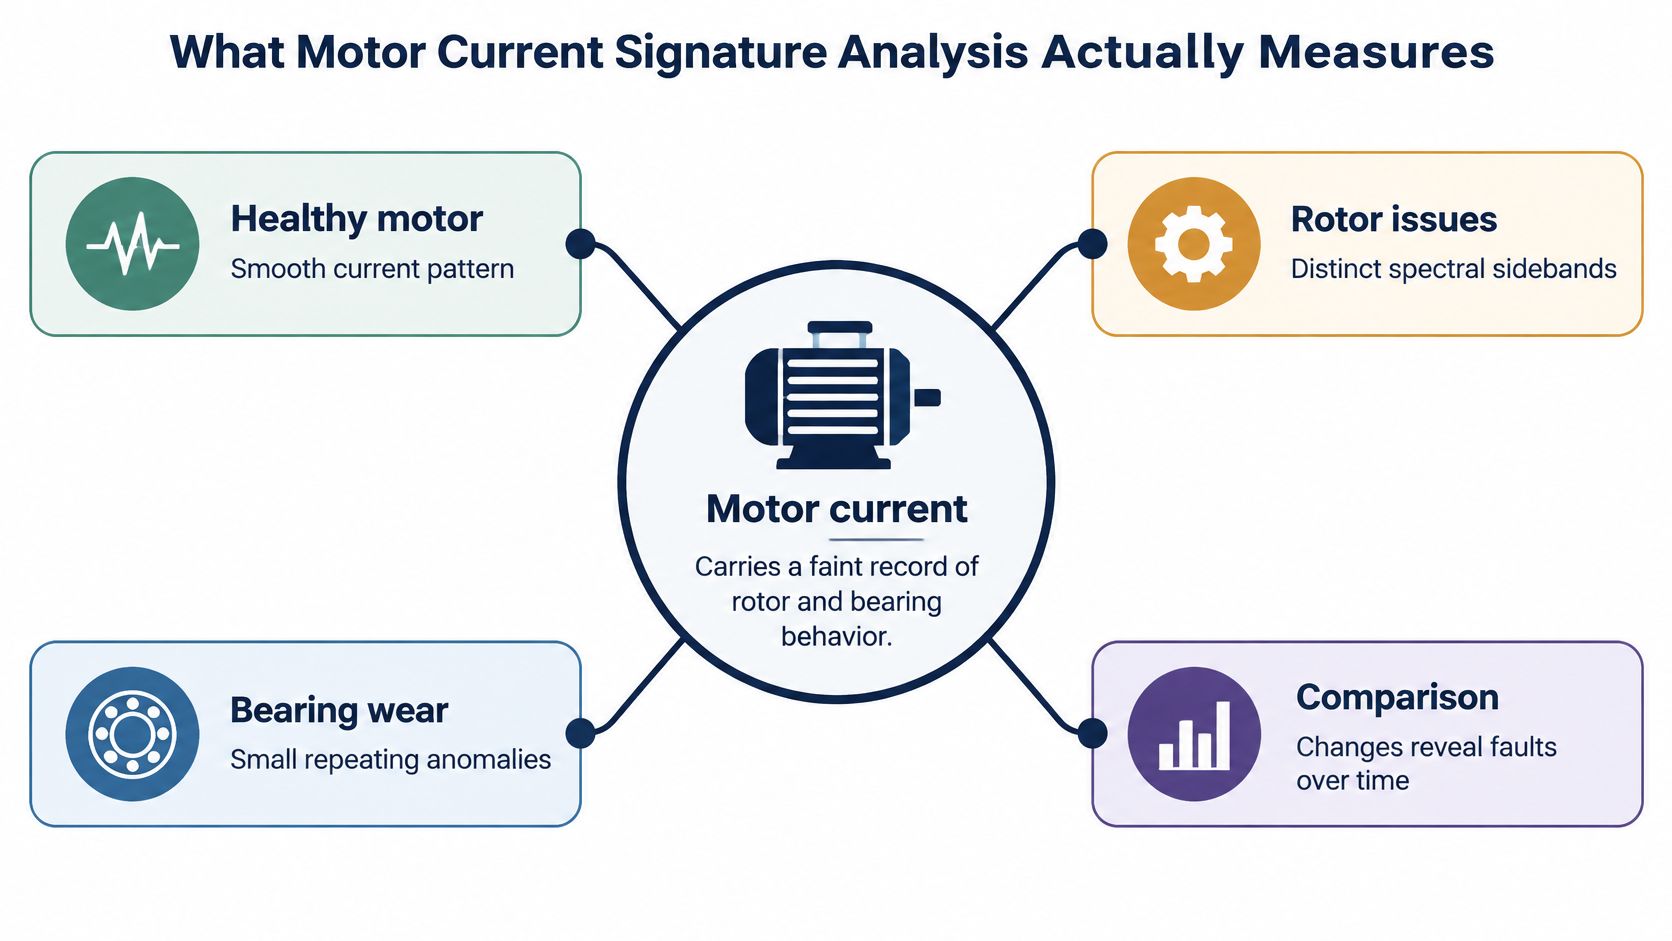
A motor's stator current carries a faint record of rotor and bearing behavior, much as a heartbeat trace carries information about the heart. The instrument measures current, not physical damage. An analyst interprets how electromagnetic and mechanical disturbances change that current.
For a healthy motor operating steadily on a near-sinusoidal supply, the spectrum usually has a dominant peak at the electrical supply frequency. Periodic disturbances can add sidebands, harmonics, or changes in spectral energy. On a VFD-fed motor, that reference frequency is the drive's actual output fundamental, not the incoming mains frequency.
A foundational IEEE application paper described online detection of broken rotor bars, shorted stator turns, and air-gap eccentricity, and summarized failure surveys in which bearing-related failures represented approximately 40%, stator-related failures 38%, rotor-related failures 10%, and other causes 12% of reported induction-motor failures. Those historical survey categories explain why electrical monitoring matters, but they don't establish that current analysis detects every fault in each category equally well.
Electrical evidence, not a direct inspection
A cracked rotor bar disturbs rotor-current distribution and torque production. That disturbance can modulate stator current clearly enough to support a useful fault hypothesis. Early bearing surface damage may transmit much less electrical evidence, even when a suitable vibration measurement already looks abnormal.
You can often collect the waveform through an accessible current transducer while the motor remains coupled to its process. Existing drive instrumentation may also help, provided it exposes a suitable waveform rather than only averaged current values. A displayed current value alone isn't a current signature.
The practical advantage is online access without dismantling. It isn't permission to open an energized cabinet without the appropriate electrical-safety controls.
Working principle: A current spectrum shows the electrical consequences of a disturbance. It doesn't show the damaged component itself.
Treat MCSA as a screening and trending method. A healthy reference gives small spectral changes context; without it, an analyst can easily mistake normal motor construction, process modulation, or inverter behavior for deterioration.
Fault Signatures Hidden in the Current Spectrum
Fault signatures in motor current and how to confirm them
| Fault | Current spectrum signature | Confirm with |
|---|---|---|
| Broken rotor bar | Sidebands at f(1 ± 2s), where f is the motor electrical supply frequency and s is fractional slip | Slip-frequency trend over several loads, supported by vibration at running speed and related modulation |
| Air-gap eccentricity | Sidebands and slot-related components tied to supply frequency, rotor slot passing, and pole count | Vibration spectrum at running-speed harmonics, followed by mechanical assessment |
| Stator winding fault (shorted turns) | Increased negative-sequence current and possible low-order harmonics, with phase imbalance | Winding impedance testing and appropriate turn-insulation testing; insulation resistance provides a complementary ground-insulation check |
| Bearing defect | Weak modulation sidebands associated with bearing defect frequencies, often masked | Vibration envelope analysis and bearing temperature trend |
| Supply imbalance | Phase-current amplitude imbalance and negative-sequence current; twice-fundamental effects may appear in torque or derived indicators | Voltage measurement at motor terminals using suitable equipment |
The table gives candidate patterns, not unique fingerprints. Different disturbances can produce similar modulation, and some faults produce little measurable current change.
Read frequency relationships before amplitudes
For broken rotor bars, slip is the difference between synchronous speed and measured rotor speed, expressed relative to synchronous speed. Use actual shaft speed where possible rather than assuming commanded speed equals rotor speed. As load changes, slip changes, so the expected sideband locations move.
The paired components matter more than an isolated nearby peak. Check whether their spacing follows the predicted slip relationship and whether their behavior repeats under comparable loading. Running-speed vibration can support the investigation, but it doesn't independently prove a broken bar.
Eccentricity requires more motor information. Rotor slot count, pole configuration, and rotational speed help distinguish an air-gap-related family from ordinary slot harmonics. A peak near a predicted location is weak evidence if the motor construction is unknown.
Match the confirmation test to the suspected damage
A shorted turn can create electrical asymmetry, but unequal terminal voltages can also create unequal phase currents. Compare voltage and current together before assigning the imbalance to the winding. A satisfactory insulation-resistance result doesn't rule out a turn-to-turn fault, because ground insulation and turn insulation are different test targets.
Bearing defects typically appear as modulation around electrical components, rather than as a standalone current peak at a mechanical defect frequency. Calculate bearing frequencies from the installed bearing geometry and shaft speed, then look for supporting vibration evidence.
Supply imbalance needs particular care. A twice-fundamental component in a derived signal isn't a universal standalone marker in the raw current spectrum. Confirm terminal voltage imbalance and separate source asymmetry from inverter-output behavior before blaming the motor.
Don't authorize a rewind, bearing change, or rotor repair from a spectral lookup alone. Use the signature to choose the next discriminating test.
How to Take a Clean Current Measurement
A usable capture starts with operating context, not the Fourier transform. The objective is to preserve enough information that another technician can repeat the measurement and reach the same interpretation.
Capture a reproducible waveform
-
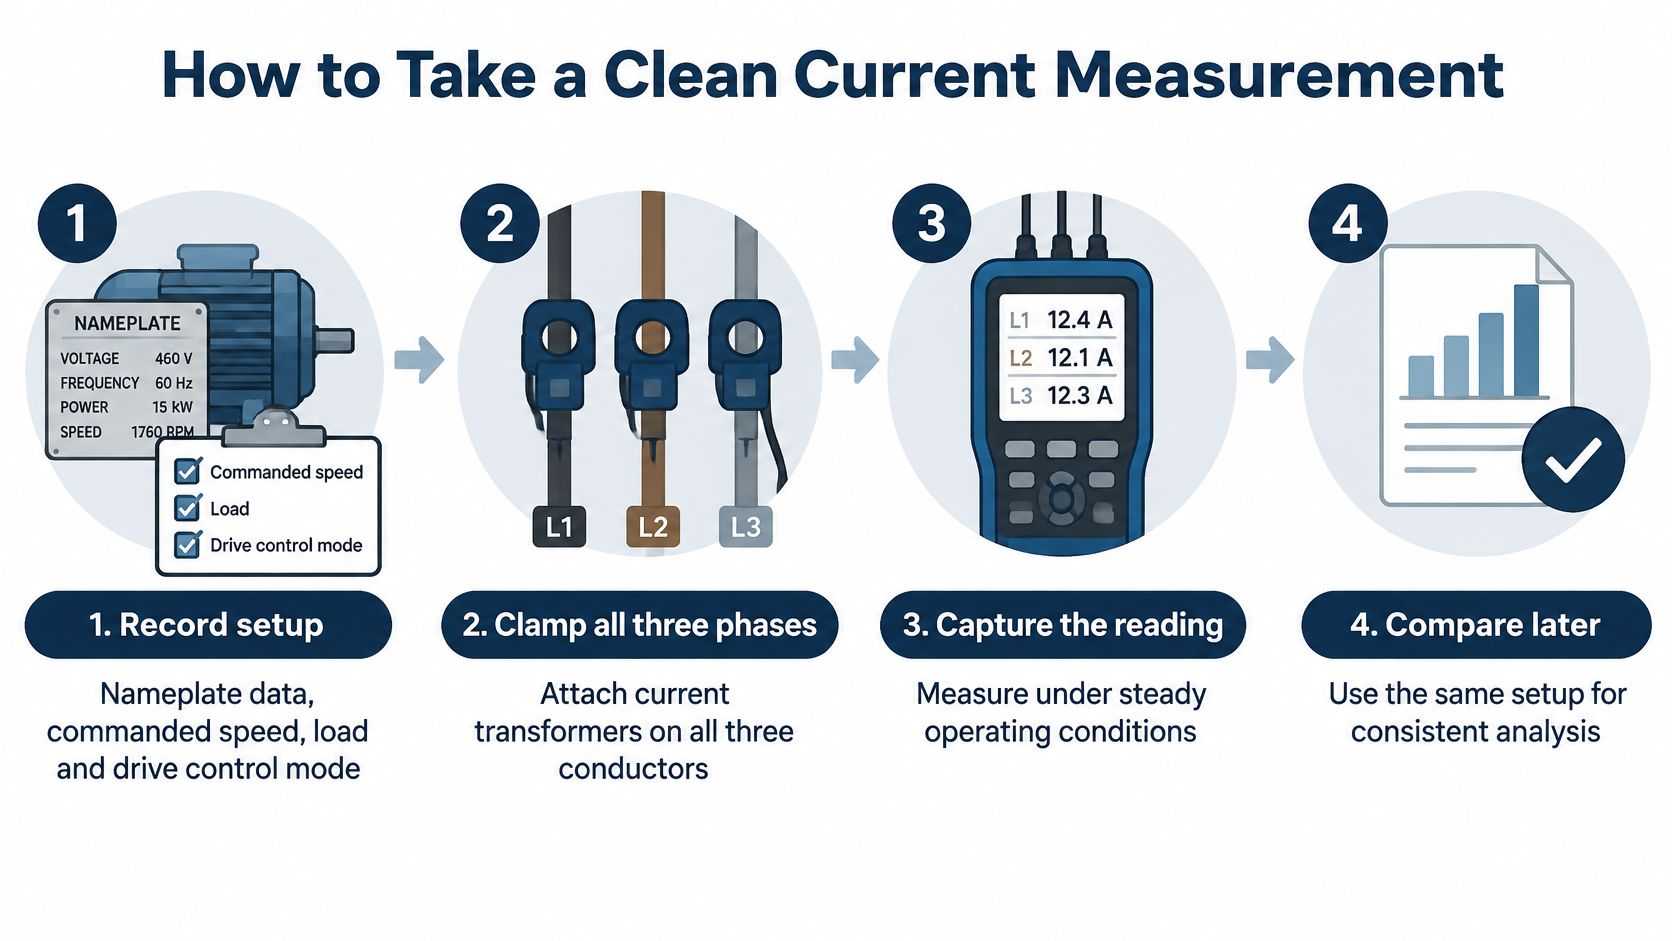
Record the setup. Save the motor nameplate, actual drive output frequency, commanded and measured speed, load indicator, control mode, and carrier setting. Include process conditions such as valve position or conveyor throughput so a later analyst can distinguish equipment change from operating change.
-
Measure all motor phases simultaneously. Place suitable current transducers around individual motor-side conductors, preserving phase identity and sensor orientation. Measuring the drive's incoming supply current isn't equivalent to measuring the motor's stator current, and a clamp around the complete multicore cable won't provide the required phase waveform.
-
Choose bandwidth and record length separately. Set sampling and anti-alias filtering for the highest frequency you intend to inspect; use sufficient capture duration to separate closely spaced components. Raising sampling rate alone doesn't resolve sidebands close to the fundamental, while a longer record won't rescue an aliased signal.
-
Capture a steady operating interval. Avoid combining acceleration, valve movement, and stable running in the same conventional spectrum. If transient behavior is the target, use an appropriate time-frequency method and retain the speed trajectory rather than interpreting a smeared steady-state transform.
-
Save the reference waveform. Establish the motor's healthy condition through maintenance history and complementary checks, then store its waveform at a documented operating point. Label repairs, bearing replacements, and parameter changes so the reference doesn't span different equipment configurations.
-
Annotate the spectrum. Mark the electrical fundamental, predicted candidate frequencies, and each candidate's amplitude relative to the fundamental. Preserve window type, amplitude convention, filtering, and analyzer configuration because changing them can change the apparent trend.
-
Repeat with consistent settings. Schedule comparable captures according to asset criticality and the suspected deterioration mechanism. Retain raw waveforms, not just screenshots, so an engineer can reprocess the evidence when the fault hypothesis changes.
Check the measurement chain
Use rated, isolated instrumentation suitable for the circuit and inverter environment. Follow site electrical-safety procedures for access, isolation, live measurements, and residual-energy checks; installation of permanent sensing may require a planned outage.
Confirm that the transducer doesn't saturate and that the acquisition channel doesn't clip. Check channel scaling and phase alignment before interpreting negative-sequence quantities. When selecting predictive maintenance sensors, waveform access, usable bandwidth, and repeatable installation matter more than a dashboard's fault label.
The deliverable should include a repeatable spectrum, a clearly identified reference, operating metadata, and a trend of the specific feature under investigation. A colorful transform without those records is difficult to use for maintenance decisions.
Reading Spectra on VFD-Driven Motors
A pump motor trips, and its current spectrum shows an unfamiliar sideband. On a VFD-fed motor, the inverter can create spectral components that resemble fault signatures, so interpret the peak against the drive's operating conditions before assigning a cause. The technical review of inverter-fed diagnostics discusses how variable speed and switching content complicate fault interpretation, particularly when early defects produce weak current changes.
Carrier-related components and their sidebands can resemble fault harmonics. Control-related amplitude modulation may produce sidebands near the fundamental, while slot-related content can be confused with eccentricity. Process torque pulsation can also resemble mechanical-defect modulation.

Separate switching behavior from motor behavior
Use this sequence to test a candidate peak:
- Record the operating point. Note inverter output frequency, measured shaft speed, load, control mode, and carrier settings. Commanded speed alone does not establish motor slip.
- Change speed at a comparable load. Check whether the peak tracks inverter output frequency, shaft speed, slip, or switching behavior. Tracking output frequency points toward an electrical or inverter-related component; tracking shaft speed supports a mechanical interpretation. Neither relationship alone confirms a fault.
- Compare like with like. Keep load and control settings as consistent as possible. Changes in slip or current regulation can shift spectral features and obscure a meaningful trend.
- Record the interpretation and its limits. State the suspected mechanism, supporting and conflicting evidence, and the next test. Mark the result inconclusive when the capture cannot distinguish competing explanations.
Where site rules and the application permit, compare captures made with different carrier settings. Preserve the original parameters, and account for possible effects on motor heating, acoustic behavior, and drive loading before changing settings. A component that follows a carrier-setting change supports an inverter contribution. A rotor-fault hypothesis should also fit the expected slip relationship, but that fit is not proof.
Apply the checks to a trip
In the pump example, the available healthy reference was captured at a different speed and valve position. It cannot establish whether the unfamiliar sideband reflects a fault, so classify the comparison as inconclusive.
Use the trip evidence and safety checks to choose the next step. If a controlled restart is authorized, capture current at a matched operating point and compare the candidate with measured slip. If restart conditions are not satisfied, inspect the drive under isolation or use appropriate motor testing instead.
A spectrum supports diagnosis; it does not override protection indications or electrical safety checks. Keep the conclusion tied to the tested load, speed range, and control mode. MCSA is most useful here as a screening and trending method, with follow-up testing used to resolve ambiguous signatures.
How Reliable MCSA Results Are
Reported diagnostic accuracy by signal type and processing
A comparative induction-motor diagnosis study reports these results under different experimental conditions and processing methods. They are study-specific figures, not universal benchmarks.
| Signal or method | Reported accuracy | Condition |
|---|---|---|
| Manually processed current | Up to 87.41% | Investigated mechanical faults |
| Single current phase | About 91% | Compared with multi-phase fusion |
| Three-phase current fusion | About 98.3% | Combined current information from the phases |
| Current with filtering and wavelet processing | About 99% | Selected bearing-fault conditions |
| Current with mean features | 98% | Compared with RMS features |
| Vibration signals | Approaching 100% | Investigated mechanical-fault comparison |
Read the table as evidence of how results depend on the signal, features, and test conditions. The mechanical-fault comparison shows that electrical evidence can be weaker than vibration evidence for some defects. The processing results show that feature extraction and phase information can change classifier performance. They do not establish how accurately a method will classify faults on an unfamiliar, VFD-fed motor.
Separate classification from maintenance confidence
Laboratory classification asks whether recorded signals match predefined fault classes. A maintenance decision must also account for whether an unfamiliar asset is deteriorating, how urgently it needs attention, and what alternative explanations remain.
Before accepting an automated label, check that training and testing were separated by machine or acquisition campaign. Adjacent windows from the same recording should not appear on both sides of the split. Otherwise, the model may recognize recording conditions rather than learn a fault relationship that transfers to other machines.
Ask whether validation covers the loads, drive settings, temperatures, and motor configurations relevant to the intended use. The system should be able to return an uncertain or unknown result instead of forcing a match to a familiar class. Fault classification alone does not support a severity estimate.
Treat severity studies within their equipment scope
A study of broken rotor bars published in Machines evaluated a 1.1 kW squirrel-cage induction motor at fault severities of 1.5, 2, 2.5, and 3 broken rotor bars. This controlled severity sweep helps show how signals may change as damage increases. It does not establish transferable severity thresholds for an industrial fleet.
Before relying on a bar-count estimate for an unfamiliar motor, require evidence across motor sizes, manufacturers, and loading conditions. Classification accuracy also does not establish remaining service life or a safe restart limit. Judge a classifier by its performance on held-out machines and operating points, not by its headline accuracy.
Where MCSA Pays Off in Industrial Plants
Example of screening a motor fleet
During a planned production window, a maintenance team collects current waveforms from accessible motor circuits and compares motors under similar operating conditions. Unusual modulation relative to each motor's own reference moves an asset up the investigation queue; raw sideband amplitudes across unrelated motors are a poor basis for ranking.
The output is a prioritized investigation list. Unflagged motors stay in routine trending, while captures with poor signal quality are scheduled for better measurement. Vibration checks and isolated electrical tests can then be directed toward the assets with the strongest evidence of change.

Example of a long-term trend
A motor's current spectrum can change gradually over months, even when it has not triggered a trip. If a modulation feature grows across comparable operating periods, the trend can justify a focused inspection before the next planned shutdown.
Interpret the drift in context. Changes in load or drive settings can also alter spectral features, so compare measurements taken under similar conditions and check whether the pattern repeats. MCSA can narrow the search; the trend alone does not identify a confirmed fault or set a replacement date.
Example of a feeder-related problem
After a feeder alteration, technicians find unequal phase currents and an abnormal twice-fundamental indicator. They inspect the incoming supply and connections, then review the drive's event history to identify where the imbalance may originate.
For an inverter-fed motor, distinguish incoming voltage asymmetry from motor-output asymmetry. Rectification and current regulation can keep an upstream problem from appearing in the same form at the motor terminals. Suitable voltage measurements help locate the electrical issue.
MCSA is most useful for fleet screening and investigation prioritization. Very early bearing wear may produce a weak electrical disturbance, while light loading can place rotor sidebands close to the fundamental. In those cases, use complementary measurements and treat a quiet spectrum as limited evidence, not proof of motor health.
Set a Baseline Before You Act on an Alarm
Choose among keep trending, run a deeper test, or escalate. An alarm should trigger an evidence-based decision, while an active protective condition or unsafe electrical finding takes precedence over trend collection.
Build the decision record around a healthy capture from the same motor at matching speed and load. Record the drive's operating data at the same time, then compare repeated measurements using consistent processing. Practical predictive maintenance for motors depends on connecting that record to a defined action.
Prepare a reviewable decision
- Keep trending when the feature is stable, operating conditions match, and supporting checks reveal no reason for urgent intervention.
- Run a deeper test when a repeatable feature grows or another measurement supports deterioration. Select vibration, thermal, winding, or insulation testing according to the suspected mechanism, scheduling isolation where required.
- Escalate when the signature remains ambiguous, trips recur, or the consequences of an incorrect decision are unacceptable.
For engineering review, include the drive brand, exact model code, rated power and voltage, fault code exactly as displayed, when the fault occurs, and the operating environment. Attach a nameplate photo, fault records, raw waveforms, and the trend with its baseline.
Every service request we receive is reviewed by an engineer. We confirm whether the specific brand, model, and voltage class can be serviced from the equipment details provided, rather than assuming coverage before review.
End the assessment with the selected path, its justification, and the evidence needed to change it. That gives operations a clear instruction without pretending a spectrum can answer every reliability question.
DUCHENG Industrial offers structured VFD troubleshooting, controlled restart support, and workshop diagnosis to help separate drive faults from motor and process problems. Visit DUCHENG Industrial to submit your equipment details, fault records, and current-signature evidence for engineering review.