
Learn how predictive maintenance for motors cuts downtime and cost. Covers data sources, KPIs, VFD-integrated monitoring architecture, and ROI
A motor predictive-maintenance program can reduce overall maintenance costs by 20% to 30%, cut unplanned-downtime costs by 15% to 25%, and lower repair costs by 22% to 28% through earlier fault detection, according to a widely cited industrial benchmark summarized by World Metrics' predictive-maintenance statistics. For industrial motors, the same benchmark reports a 10% to 15% equipment-life extension and an 18% to 24% increase in mean time between failures, or MTBF.
Those figures are useful, but they don't make the business case by themselves. In a brownfield plant, the work is deciding which motors deserve sensors, extracting useful data from mixed-brand VFDs, turning alarms into planned work, and proving that MTBF, MTTR, downtime, and maintenance cost moved in the right direction. Predictive maintenance for motors succeeds when the analytics fit the maintenance system, not when a dashboard displays more signals.
Table of Contents
- When an Unplanned Motor Failure Stops a Critical Line
- What Predictive Maintenance for Motors Really Means
- The Data Sources That Actually Catch Motor Faults Early
- From Raw Signal to MTBF and MTTR Improvements
- Architecting a VFD-Integrated Motor Monitoring Stack
- Building the Business Case and ROI Model That Survives Scrutiny
- Misconceptions That Sink Motor PdM Programs
- FAQs Plant Managers Ask Before Approving a Predictive Maintenance Budget
When an Unplanned Motor Failure Stops a Critical Line
During a peak shift at a steel works, a 250 kW induction motor driving a mill fan seized at its drive-end bearing. The motor had been running hot during load changes, and operators had noticed a harsher sound during rounds, but neither observation had become a documented condition trend. The trip stopped the line immediately.
The fan supported a process producing roughly 18 tonnes per hour. Four hours of lost production followed before the team could isolate the failed motor, source the replacement bearing, complete the repair, align the coupling, and return the line to stable operation. The production loss was only the first item. Quality giveback, emergency overtime, expedited spares, and the restart sequence added costs that never appeared on the bearing invoice.
The warning existed, but the system didn't use it
This is the pattern I see most often in older plants. The failure looks sudden on the maintenance report, yet the equipment had already provided clues. Bearing vibration rises, temperature drifts against ambient, current changes with load, and a VFD may record operating conditions that explain when the abnormal behavior began.
A route technician might catch one of those clues during a periodic inspection. A predictive program keeps the clue attached to the asset, compares it with a credible baseline, and assigns a response before the bearing reaches seizure.
Practical rule: A motor alarm has no operational value until someone knows what decision it should trigger, who owns that decision, and when the work can be performed.
The point isn't to monitor every motor with the same intensity. Critical fan, pump, compressor, conveyor, and mill-drive motors deserve attention because their failure can stop production or create a safety exposure. Less critical motors may remain on preventive or run-to-failure strategies if their replacement is simple and their outage has little consequence.
VFD-driven assets make this more important, not less. Variable speed changes the motor's electrical and mechanical behavior, while harmonics, rapid load changes, cooling limitations, and drive faults can complicate ordinary inspection. A condition-aware system combines the drive's operating data with external motor measurements so the maintenance team can distinguish a genuine defect from a normal speed or load transition.
What Predictive Maintenance for Motors Really Means
Predictive maintenance is a maintenance decision regime based on actual equipment condition. It sits alongside reactive and preventive work rather than replacing every other strategy.
Reactive maintenance waits for the motor to fail. Preventive maintenance replaces, lubricates, inspects, or tests components according to time, operating hours, or production cycles. Predictive maintenance watches the condition indicators that precede failure and schedules intervention when the evidence justifies it.
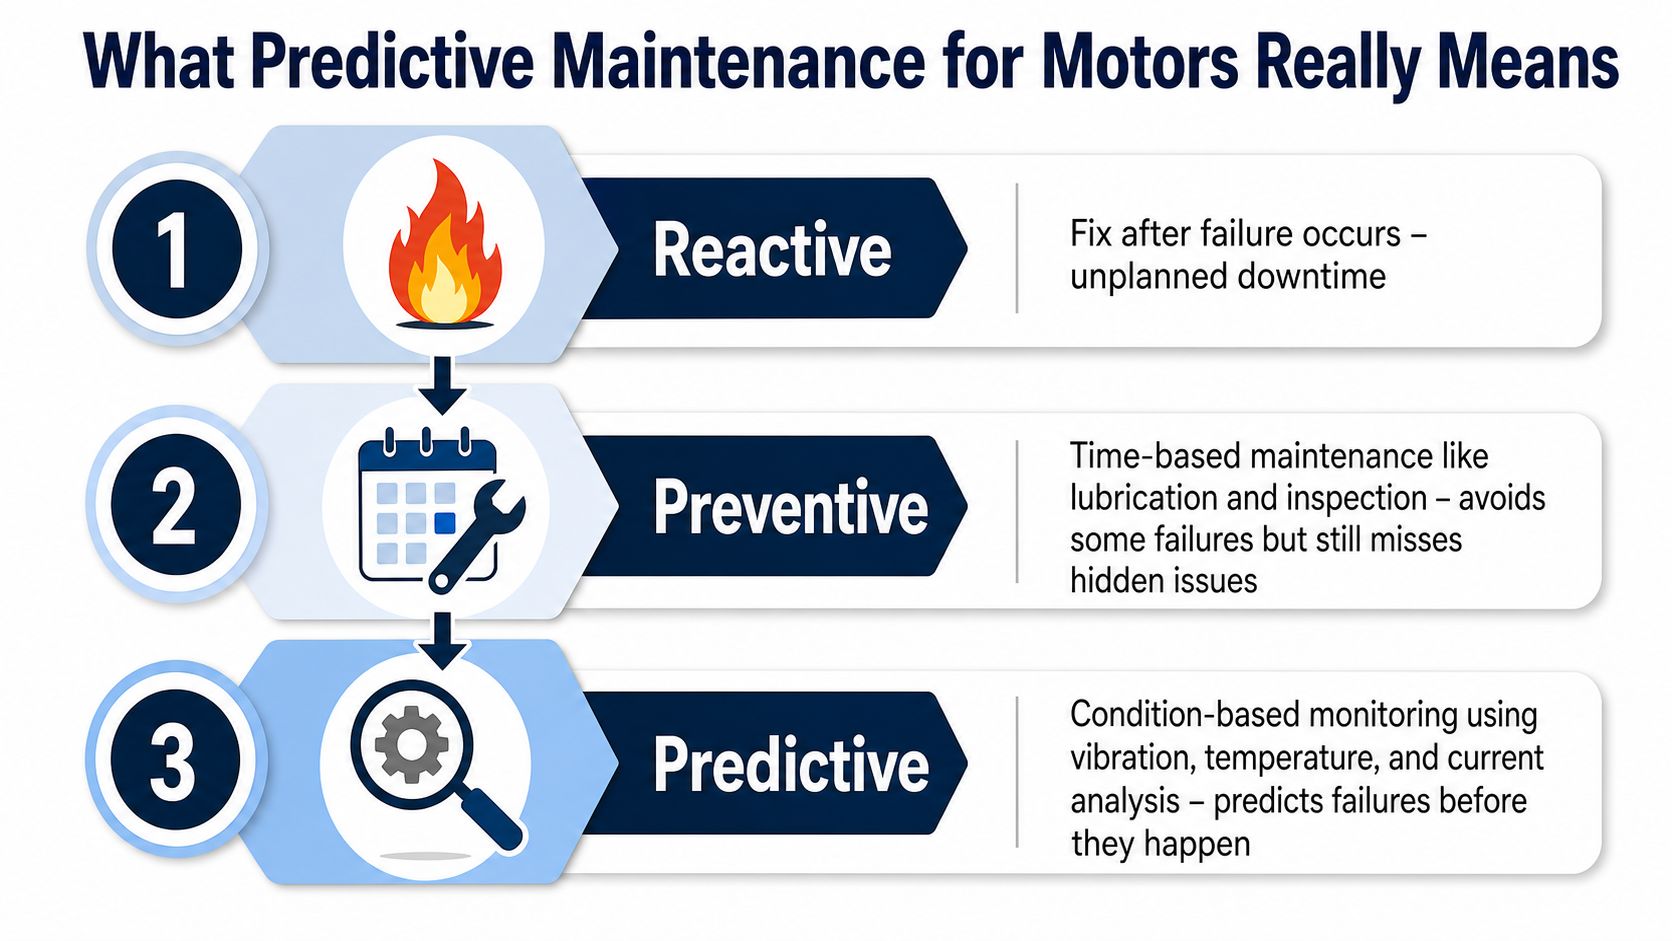
The hierarchy on a real motor fleet
A practical fleet normally uses all three approaches:
- Reactive work suits non-critical motors that are inexpensive, accessible, and unlikely to cause secondary damage when they fail.
- Preventive work remains appropriate for lubrication, alignment checks, insulation tests, cooling-system cleaning, and other tasks with a known maintenance requirement.
- Predictive work adds condition triggers, such as rising bearing vibration, abnormal current signatures, or a temperature trend that departs from the motor's normal operating envelope.
The boundary between preventive and predictive matters. Replacing a bearing every fixed interval may avoid some failures, but it can also remove serviceable parts or miss a defect that develops between scheduled interventions. A predictive trigger asks a different question: what is the motor telling us now, and how much time remains to plan the response?
What “predicting” means in practice
For motors, the target isn't an abstract failure probability. It is a recognizable failure family and a maintenance decision. Common targets include:
- Bearing degradation, including lubrication loss, spalling, looseness, and contamination.
- Stator-winding deterioration, including insulation damage and electrical imbalance.
- Rotor defects, including cracked or broken rotor bars.
- Cooling loss, caused by blocked passages, failed fans, or excessive ambient conditions.
- Misalignment and imbalance, which create mechanical stress and recurring vibration.
The analytical foundation is well established. A 2015 prognostics and health-management paper summarized in later research described induction-motor failure patterns of roughly 41% bearing faults, 37% stator-winding faults, 10% rotor faults, and 12% other faults. That concentration explains why a focused program often outperforms a broad but shallow sensor rollout.
The Data Sources That Actually Catch Motor Faults Early
No single motor signal sees every failure mechanism. Vibration reveals mechanical behavior, current reveals electrical behavior, thermal data shows heat accumulation, and process data explains whether the motor was operating under a condition that makes the other signals meaningful. The practical approach is to fuse at least two streams on critical assets.
Vibration
Tri-axial accelerometers mounted at the drive-end and non-drive-end bearing housings are the primary mechanical channel. Overall velocity RMS helps classify severity, while acceleration and envelope analysis expose bearing-impact patterns, lubrication problems, looseness, imbalance, and misalignment.
Mounting quality matters. A poorly fixed wireless node can create a false trend, and a sensor installed far from the bearing may miss high-frequency energy. Vibration also has a boundary: it may show the mechanical consequences of an electrical problem, but it won't reliably identify a stator turn-to-turn fault at its earliest stage.
Electrical measurements
Motor current signature analysis uses current and voltage behavior to investigate rotor-bar defects, eccentricity, electrical imbalance, and some stator conditions. Spectral sidebands around line frequency can indicate broken rotor bars. VFD telemetry can add output current, frequency, torque estimates, fault history, and operating-state context without installing a separate measurement device at every motor.
Current data isn't a substitute for vibration. It can be distorted by switching behavior, harmonics, changing speed, and control strategy, so the analysis must be synchronized with the motor's operating condition.
Thermal and process signals
PT100 or equivalent temperature measurements, infrared inspections, and drive-reported heatsink temperatures reveal overheating, cooling loss, overload, and electrical stress. Temperature alone is usually a late indicator, but a temperature trend normalized against ambient and load can become highly actionable.
The VFD supplies the context that makes the other streams interpretable. Speed, frequency, current, torque, acceleration, and load state help separate a genuine defect from a normal change in operating point.
| Data source | Failure mode detected | Limitation |
|---|---|---|
| Vibration | Bearing wear, imbalance, misalignment, looseness, mechanical damage | Requires correct mounting and may miss early electrical defects |
| Current and voltage | Rotor-bar defects, electrical imbalance, selected stator conditions | Sensitive to speed, harmonics, switching behavior, and load variation |
| Thermal data | Cooling loss, overload, hot spots, insulation stress | Often becomes clear later than vibration or current changes |
| VFD and process data | Abnormal load, speed-related behavior, drive stress, operating context | Drive telemetry may not expose every motor-side physical condition |
For a broader view of how this fits a plant-wide architecture, see predictive maintenance in manufacturing. The strongest implementation combines signals rather than asking one sensor to diagnose the entire motor.
From Raw Signal to MTBF and MTTR Improvements
A reliability dashboard should never stop at “healthy” or “unhealthy.” It should show how an observed condition changes the work plan and how that work changes MTBF, MTTR, planned-work percentage, and unplanned downtime.
Start with a baseline under known operating conditions. For vibration, ISO 10816-3-style severity bands commonly used in industrial monitoring place values below 2.3 mm/s RMS in an acceptable range, 2.3 to 4.5 mm/s in a monitoring range, 4.5 to 7.1 mm/s in a planned-maintenance range, and values above 7.1 mm/s in an unacceptable range requiring immediate intervention, as described in industrial motor predictive-maintenance guidance. These are decision aids, not universal limits. Motor construction, mounting, speed, foundation, and measurement location still matter.
Turning signals into work
A useful workflow looks like this:
- Baseline state: record vibration, temperature, current, speed, and load during stable operation.
- Trend state: investigate sustained movement, not one isolated sample.
- Diagnostic state: use envelope spectra, running-speed components, current sidebands, and thermal context to identify the likely fault family.
- Planning state: define the repair scope, parts, technician skills, lifting requirements, and production window.
- Verification state: compare post-repair measurements with the pre-failure trend and close the work order with the confirmed cause.
Envelope demodulation can expose bearing-impact frequencies that overall vibration hides. Running-speed components around 1X and 2X help separate imbalance, misalignment, and looseness. Current signature analysis adds evidence for rotor or electrical defects, while an ambient-compensated temperature baseline prevents the team from treating a hot production day as a new motor fault.
| Signal metric | Warning threshold | Typical failure detected | MTTR impact | MTBF impact |
|---|---|---|---|---|
| Overall vibration velocity | Use the cited severity bands and sustained trend | General mechanical deterioration | Enables planned access and parts staging | Reduces repeat run-to-failure events |
| High-frequency envelope | Rising impact energy against the asset baseline | Bearing spalling or lubrication degradation | Narrows inspection and repair scope | Supports earlier bearing intervention |
| Current spectrum | New or growing sidebands around line frequency | Rotor-bar or electrical defects | Reduces diagnostic time after isolation | Prevents electrical deterioration from becoming catastrophic |
| Temperature trend | Persistent rise after ambient and load normalization | Cooling loss, overload, hot spot, insulation stress | Helps confirm urgency and repair scope | Protects against heat-driven degradation |
| VFD operating context | Abnormal current, torque, speed, or drive temperature relationship | Load-related or drive-related abnormality | Prevents misdiagnosing a normal process condition | Improves root-cause control |
MTBF improves when the team removes the initiating defect and verifies the repair. MTTR improves when the alarm arrives early enough to schedule labor, isolate the equipment safely, stage the correct bearing or motor, and avoid troubleshooting under production pressure. A useful KPI review therefore compares alarm-to-work-order time, work-order-to-repair time, repeat-failure rate, and the ratio of planned to emergency motor work.
Architecting a VFD-Integrated Motor Monitoring Stack
A practical stack has four layers, but the VFD belongs in the sensing architecture from the beginning. Treating it as merely a control device leaves valuable operating context outside the reliability model.
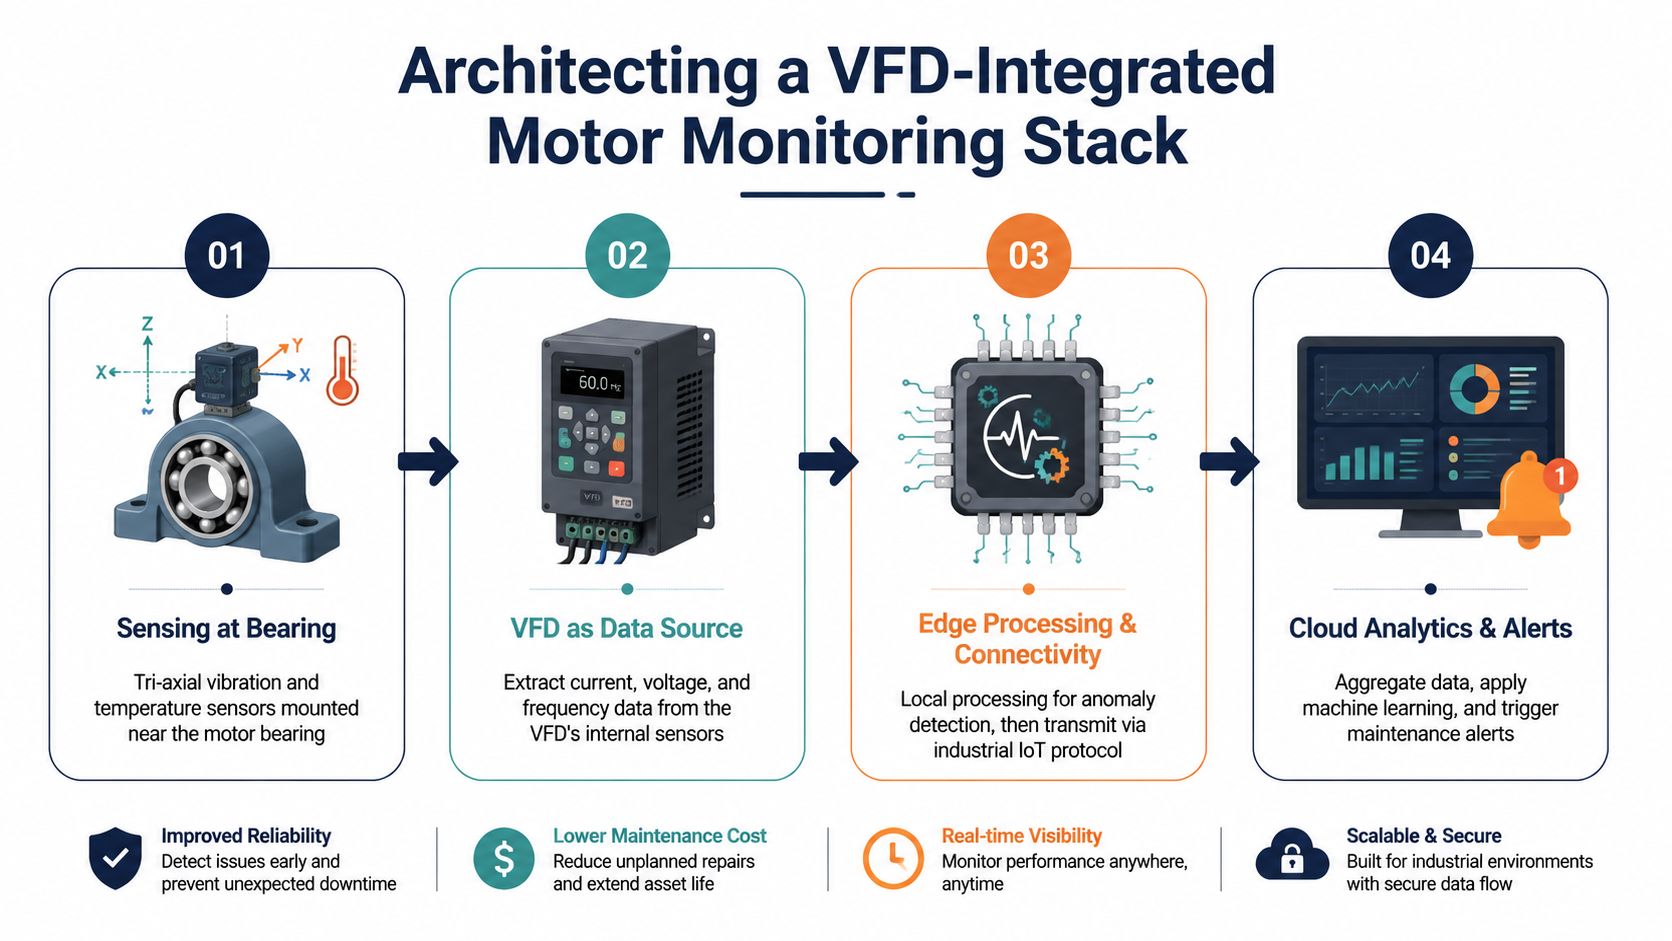
Sensing and collection
At the motor, install vibration sensors near the bearing housings and add temperature measurement where the asset's criticality justifies it. At the electrical side, collect current and voltage either from the drive's available telemetry or from appropriately installed current transformers. Don't route low-level sensor wiring beside VFD output cables without a deliberate EMI-control plan.
Wireless vibration is attractive when cable installation would require a shutdown, conduit work, or hazardous-area review. Hardwired sensors make more sense on assets that need continuous high-frequency data, deterministic sampling, or integration with an existing protection system. The mounting method must suit the frame and housing. A magnetic attachment may be acceptable for a route measurement, but a permanent monitoring node should have a repeatable, mechanically stable installation.
Edge and industrial connectivity
An edge gateway can collect analog sensors, vibration packets, and VFD parameters, then apply filtering or basic anomaly rules close to the asset. In a mixed-vintage plant, protocols such as Modbus TCP, OPC UA, PROFINET, and Ethernet/IP typically occupy different points in the control and data path. The right choice depends on what the installed PLC, drive, historian, and network segmentation already support.
The gateway should preserve timestamp alignment. A current sample taken during one speed state cannot be compared casually with vibration captured during another. Store asset identity, speed, load, operating mode, and sensor health alongside the measurement.
Analytics and maintenance execution
The analytics layer can run envelope processing, spectral analysis, current signature analysis, thermal trending, and anomaly detection. Use model outputs as diagnostic evidence, not automatic permission to shut down a critical line. The CMMS or EAM system should receive a structured alert containing the asset, observed condition, confidence or severity, recommended inspection, and due date.
For plant-wide connectivity practices, industrial IoT monitoring architecture provides relevant integration context. The final layer is human execution. A technician validates the condition, a planner schedules the work, operations releases the equipment, and the completed job feeds confirmed failure information back into the model.
The VFD tells you how the motor was being driven. The bearing sensor tells you how the machine responded. You need both to diagnose many brownfield faults responsibly.
Building the Business Case and ROI Model That Survives Scrutiny
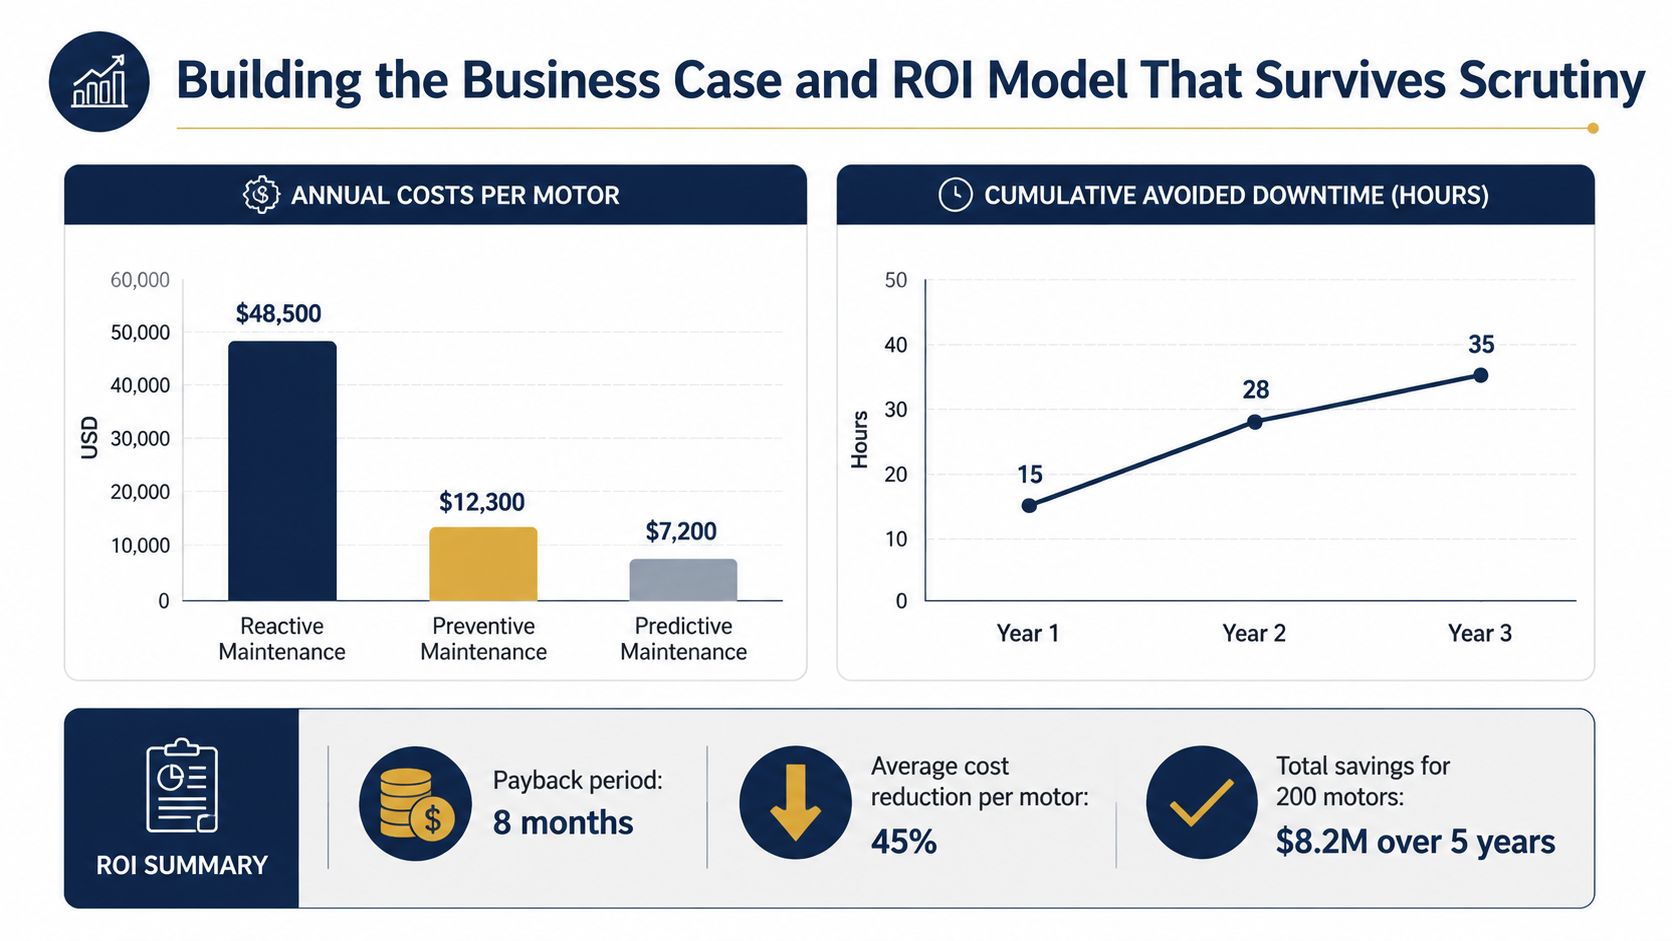
Finance teams don't approve predictive maintenance because a model can classify a waveform. They approve it when the avoided failure, implementation cost, labor requirement, and residual risk are visible in the same calculation.
Start with each critical motor's failure consequence. Record production rate, contribution margin per unit, restart duration, emergency labor, spare-part availability, quality exposure, and any safety or environmental consequence. Then calculate the cost of an unplanned event using plant-owned values. Don't use a generic downtime figure when the line manager can challenge it in the budget meeting.
A defensible calculation
For each candidate motor, estimate:
Avoided loss = probability of an actionable failure × consequence of failure × proportion of failures the program can reasonably intercept.
Keep the assumptions explicit. The model should distinguish between a detected bearing issue that can wait for the next planned outage and a stator defect that requires immediate isolation. It should also include the cost of sensors, installation, network changes, analytics, training, inspection time, and false-alarm investigation.
The benchmark evidence supports the economic direction. The industrial predictive-maintenance benchmark reports 20% to 30% lower overall maintenance costs, 15% to 25% lower unplanned-downtime costs, and 22% to 28% lower repair costs through earlier fault detection. Those ranges should be treated as an external reference, not copied into a site budget without validation.
Roll out by consequence, not by convenience
A sensible brownfield deployment begins with the motors that combine high downtime exposure, difficult access, long replacement lead time, high energy demand, and strong condition-monitoring potential. A small pilot can reveal whether the plant has enough data quality, maintenance discipline, network access, and diagnostic skill to scale.
Use low and high scenarios. In the low case, count only documented avoided downtime and planned repair savings. In the high case, add reduced secondary damage, better spare positioning, fewer emergency callouts, and improved equipment life, while labeling those items as assumptions rather than guaranteed returns.
The business case can fail even when the sensor data is good. It fails when alerts don't create work orders, work orders aren't scheduled, technicians don't record findings, or operations won't release the asset before the defect becomes urgent. Safety and compliance benefits matter too, but they should be presented as risk reduction, not disguised production savings.
Misconceptions That Sink Motor PdM Programs
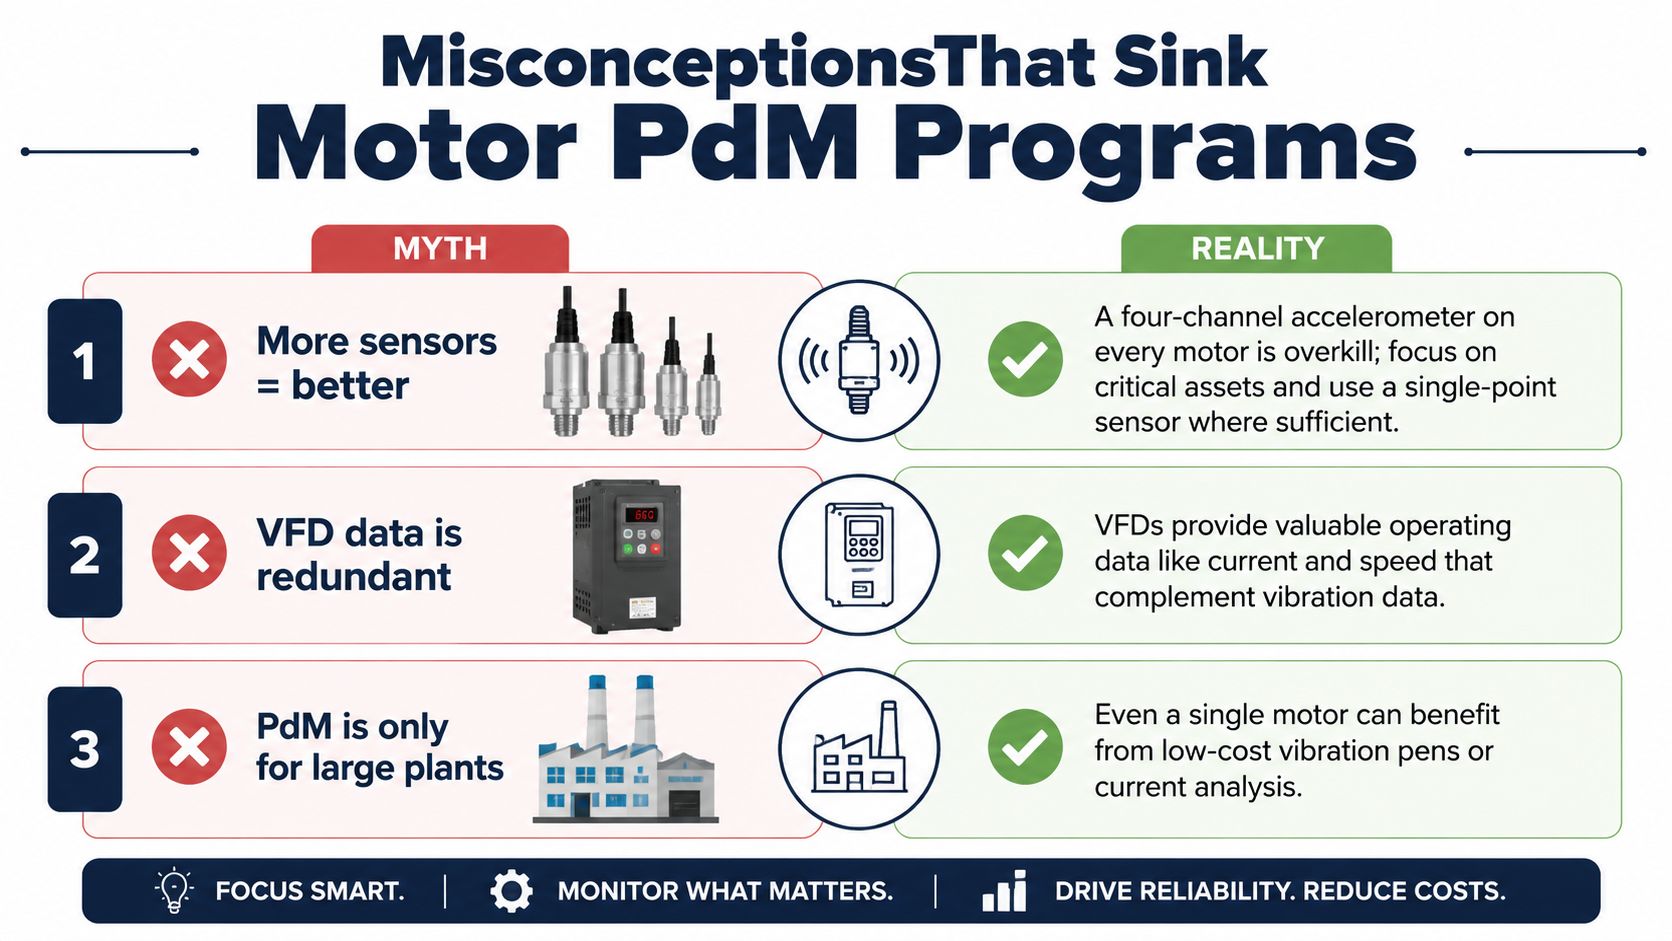
Motor PdM programs usually struggle because of deployment decisions, not because vibration analysis is impossible. Three assumptions cause repeated trouble in steel, chemical, and process plants.
More sensors always produce better decisions
A dense sensor grid can create more data without creating more certainty. Critical assets may justify tri-axial vibration, temperature, current capture, and continuous drive telemetry. A general-purpose motor may need a simpler arrangement, especially when technicians can access it easily and its failure has limited production impact.
The correct question is whether each channel changes a maintenance decision. If it doesn't, the channel adds installation, network, storage, calibration, and alert-management burden without a clear return.
AI works immediately after installation
It doesn't. Recent reviews identify insufficient fault data, model drift, data heterogeneity, and the lack of standardized frameworks as persistent industrial barriers, as discussed in this review of digital-twin approaches to predictive maintenance. A model needs a trustworthy healthy baseline, operating context, asset-specific tuning, and feedback from completed inspections.
Cold-start systems should begin with anomaly detection and engineering rules, then mature as confirmed findings accumulate. A confident alert with no diagnostic path is not a reliability improvement.
PdM replaces preventive maintenance
Lubrication, alignment, insulation testing, cooling-system cleaning, and planned bearing work don't disappear because a sensor is installed. Predictive maintenance changes the timing and scope of some interventions. It doesn't remove tasks whose purpose is contamination control, legal compliance, or known life-limiting maintenance.
Harsh environments make these distinctions more important. Recent literature describes industrial motor data as incomplete, noisy, nonlinear, and inconsistent, while a review of motor predictive maintenance under demanding conditions highlights edge deployment, explainable AI, standardized benchmarks, sparse-data methods, and low-power sensing as important development needs. In practice, clear rules, good mounting, and local processing often outperform an opaque model trained on conditions that don't resemble your plant.
FAQs Plant Managers Ask Before Approving a Predictive Maintenance Budget
How soon should we expect a return?
The answer depends on failure consequence, asset access, data quality, and whether the pilot is anchored to a critical motor. Don't approve a fleet-wide program on an assumed payback. Approve a measured pilot with defined acceptance criteria, such as documented avoided downtime, completed planned repairs, diagnostic confirmation, and movement in emergency motor work.
Which motors should we instrument first?
Rank assets by downtime cost, safety exposure, replacement difficulty, energy significance, and detectable failure modes. VFD-driven motors that are hard to access or that support a bottleneck line usually rise to the top. Sensor availability alone is a poor selection rule.
Do we need to replace our existing drives?
Usually not. Many installed drives expose operating data through industrial communications, while legacy units can be supplemented with external current transformers, vibration sensors, and temperature devices. Confirm the available parameter list, sampling behavior, network permissions, and whether the drive data is suitable for diagnosis rather than assuming every value is equally useful.
What happens to vibration routes?
Routes remain valuable. PdM reduces the burden of finding every abnormality manually, while technicians still verify alarms, inspect mounting and lubrication, check alignment, and confirm the repair. The work shifts from routine collection toward diagnosis and root-cause control.
Will this replace reliability personnel?
No. People still approve interventions, manage isolation, interpret ambiguous evidence, and decide whether a motor can safely run until a planned outage. A closed-loop program makes experienced technicians more effective because it gives them prioritized evidence and a documented history.
| Question | Answer |
|---|---|
| What should the first budget fund? | Critical-asset assessment, sensors where justified, edge connectivity, analytics, CMMS workflow, and technician training |
| What proves the pilot worked? | Confirmed alerts, planned interventions, avoided emergency work, better diagnostic lead time, and credible KPI movement |
| What commonly breaks the business case? | Poor baselines, unmounted or unreliable sensors, ignored alerts, missing work-order feedback, and unclear ownership |
| How should success be reported? | Track MTBF, MTTR, unplanned downtime, planned-work ratio, repeat failures, alert-to-action time, and maintenance cost |
Predictive maintenance for motors is a reliability operating model, not a sensor purchase. DUCHENG Industrial supports VFD lifecycle work, multi-brand drive diagnostics, preventive care, on-site reconditioning, spare-part verification, and IoT monitoring architecture for industrial sites. Visit DUCHENG Industrial to discuss a brownfield motor and VFD monitoring plan built around your critical assets, existing controls, and maintenance workflow.