
Learn where variable speed drive efficiency is lost, why it drops at part load, and how to maximize real savings with measured, system-level checks.
A VSD doesn't save energy just because it has a high efficiency rating or because it slows a motor down. The useful figure is the energy needed to deliver the same process output, measured across the drive, motor, auxiliaries, and load. Ignore that boundary and a nameplate can promise more than the plant saves.
At its design point, a drive may convert most of its input power into useful output. But operating speed, load, cooling, harmonics, and control settings all affect what the system draws. The practical question isn't only how efficient the drive is on paper. It's what the complete installation consumes while doing the work production requires.
Table of Contents
- The Efficiency Numbers a Drive Really Delivers
- Where Drive Losses Come From and Why They Shift With Load
- Harmonics, Cooling and Auxiliary Loads That Cut Savings
- How to Measure Efficiency Across the Whole Drive System
- How to Maximize Variable Speed Drive Efficiency Step by Step
- Real Savings Cases and What They Show
- Confirm the Savings Before Replacing a Drive
The Efficiency Numbers a Drive Really Delivers
The efficiency figure on a drive datasheet is honest, and it is still misleading. It describes a single operating point: rated load, rated speed, the test conditions the manufacturer selected. Most drives spend their working lives somewhere else, and the number moves with them.
At the design point, a drive converts the great majority of incoming power into useful output. Efficiency falls as load drops, because part of every drive's losses stays nearly constant whatever the motor delivers. Small drives carry that fixed share hardest, and the largest units usually sit at the top of any band. The table below is a worked example, a representative efficiency-versus-load profile for a well-sized low-voltage drive, useful for planning rather than as a promise for any specific unit.
| Operating point | Typical drive efficiency | What dominates the loss |
|---|---|---|
| Full load, rated speed | 96–98% | Switching and conduction losses at the design point |
| 75% load | 95–97% | Conduction losses fall with current; fixed losses remain |
| 50% load | 93–96% | Fixed losses take a larger share of the total |
| 25% load | 85–93% | Fixed losses dominate the total |
| Small drive under 5 kW, full load | 92–96% | Fixed losses are a larger share of a small output |
Run the arithmetic once and the stakes become concrete. At 96% efficiency, a system delivering a 500 kW shaft load draws about 521 kW from the supply. Roughly 21 kW turns into heat inside the drive cabinet. That heat must leave the electrical room through fans or air conditioning, loads that sit outside the efficiency figure entirely.
Read the curve at your real operating point
Many pump and fan systems spend substantial operating time below full load, so the lower rows of the table may matter more than the headline figure. Find the point on the manufacturer's efficiency-versus-load curve that matches normal duty, then check whether it sits on the flatter part of the curve. Ask for the curve at the actual speed and carrier frequency in service, since the datasheet conditions may differ from the settings left at commissioning.
A 2024 Scientific Reports case study at a drinking-water purification plant measured 24-hour electricity use with and without a VSD to quantify the pump-motor energy savings the installation delivered. A metered comparison like that captures the whole system and tells you more than an estimate built on a motor rating.
The gap between the rated figure and the part-load figure is the fixed-loss share at work. Fans, control electronics and the DC link draw close to the same power at light load as at full load, so a nameplate number survives only near the point where it was measured.
Where Drive Losses Come From and Why They Shift With Load
A VSD is a chain of power-conversion stages. Incoming AC passes through a rectifier, a DC link smooths the converted power, and inverter switches build the variable-frequency output for the motor. Each stage takes a small cut, much like a toll road where every gate skims part of the traffic.
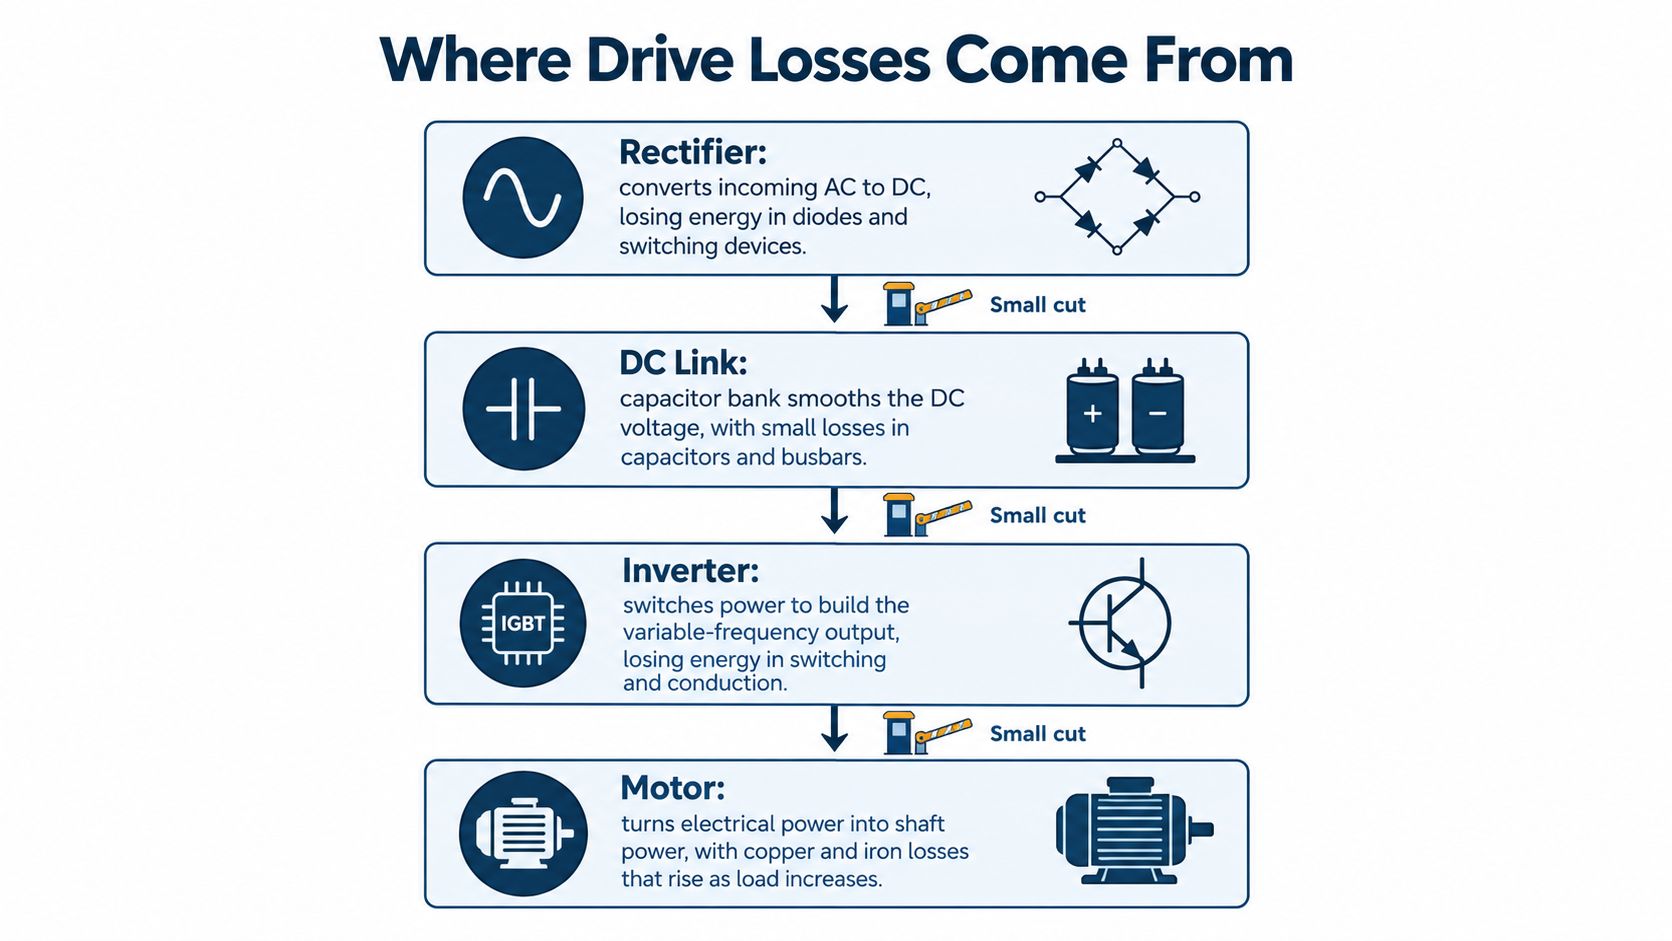
What changes as current and speed change
Rectifier and conduction losses rise with current. Inverter switching losses rise with carrier frequency, so increasing the carrier frequency can make a motor sound smoother while adding heat inside the drive. Capacitors, busbars, control boards, gate drives, and fans contribute other losses. Many of those fixed loads change little as motor output falls.
That fixed share explains much of the part-load penalty. If the motor delivers less power but the control electronics and fans keep drawing nearly the same amount, those fixed losses take up more of the smaller total. The drive can still operate correctly while its efficiency falls.
The drive isn't the only point where energy disappears. The motor adds copper and iron losses, and the driven process can waste power through throttling or poor control. For a plant manager, the right boundary is the complete conversion chain and the useful process output, not the drive terminals alone.
A regulatory floor, not a field guarantee
The EU made VSD losses a regulated product attribute under Regulation (EU) 2019/1781. Covered drives rated from 0.12 kW to 1,000 kW must not exceed maximum losses associated with the IE2 efficiency level. The regulation was adopted on 1 October 2019 and applied from 1 July 2021.
That benchmark helps with procurement and lifecycle decisions. It also gives maintenance teams a reference point when they assess cabinet heat, operating cost, or whether an aging drive remains serviceable. But meeting a minimum product limit doesn't guarantee good results at every load, ambient temperature, or control setting.
The drive's own loss is only one part of the system total. The largest controllable gains usually come from matching drive operation to the application and keeping the installation in sound condition.
Harmonics, Cooling and Auxiliary Loads That Cut Savings
A VFD can cut process energy and still push losses elsewhere in the electrical system. It draws current in pulses rather than as a smooth sine wave, and that distorted current adds heating in motors, cables, and transformers. A slower motor does not automatically mean a more efficient plant.
A 2025 review of VFD harmonic effects and efficiency reports distortion levels that differ sharply between applications and operating points: current total harmonic distortion (THD) rising from roughly 13% to 30% after VFD adoption in one industrial case, a steel-industry monitoring result reaching 45% at low frequency, and another measurement of 71.8% at 50 Hz that fell to 23% at 20 Hz as network impedance changed.
Measure across the operating range, then decide
Harmonic readings move with speed, load, and grid strength, so a single measurement at one operating point cannot define a plant's profile. Take THD readings at representative speeds and loads, and check motor, cable, and transformer temperatures at the same time. That combination shows whether distortion is a minor artifact or a genuine source of heat and wasted energy.
DUCHENG's guide to harmonic filters for VFDs sets out the main mitigation options. The test for any of them is whether the measure recovers enough energy or reliability to cover its own cost and losses. Where distortion is modest and equipment temperatures are normal, spending on mitigation hardware often returns less than it costs.
Cooling deserves the same scrutiny. Drive losses leave the cabinet as heat, and sustained high temperature shortens the life of capacitors and IGBT modules. Dust-clogged heatsinks, blocked airflow, or a weakening fan erode thermal margin long before a fault code appears. Cleaning the cooling path and restoring fan performance costs little, and it recovers margin that a replacement drive would only mask for a while.
Auxiliary loads also inflate the baseline. Cooling fans, cooling pumps, space heaters, control power supplies, and dehumidifiers can draw power even while the motor sits idle, and none of them appear in a drive-terminal reading. Count them in the system figure. Keep in mind that an IE2 rating is earned under defined test conditions; it says nothing about your enclosure, ambient temperature, cooling state, or harmonic environment.
Tie efficiency checks to thermal inspection and harmonic surveys, especially on aging low-, medium-, and high-voltage assets.
How to Measure Efficiency Across the Whole Drive System
A drive nameplate tells you about the product under defined conditions. It doesn't tell you how much energy the plant saves while delivering a particular flow, pressure, or production rate. The measurement boundary matters: a drive-terminal reading misses the motor and process, while a motor measurement can still omit separately powered auxiliaries.
IEC 61800-9-2 provides a method for determining losses and efficiency classes for drive modules and complete power-drive and motor systems. For field verification, establish a baseline that reflects actual operation, including partial-load periods, and normalize the comparison to useful production. A 2025 chiller study also illustrates how settings affect measured outcomes: it reported average efficiency improving from 0.7672 to 0.9559, a 24.6% improvement, alongside reductions in THD and distortion-loss ratio (the VFD-controlled chiller study).
| Measurement point | What it captures | Common trap |
|---|---|---|
| Drive input terminals | Total electrical input in kW | Misses separately powered fans and auxiliary circuits |
| Motor shaft or motor terminals | Motor output and motor losses | Needs torque measurement or a motor-side power meter |
| Process output, such as flow, pressure, or tonnes | Useful work delivered | Output must be normalized before comparing |
| Cooling-fan and auxiliary circuits | Auxiliary consumption | Often left out of the drive nameplate figure |
| Point of common coupling | THD and power factor | Harmonic readings change with operating point |
A field routine that produces a fair comparison
Log a baseline before a change across at least one complete production cycle, including low-load periods. Record drive input kW, motor output or process throughput, speed, torque, power factor, harmonic distortion, cooling-fan consumption, and operating hours. After the intervention, repeat the same measurements under similar production conditions.
Compare energy per unit of product, not just raw kWh. A fixed-speed system with a throttled valve may have been wasting energy before the drive was installed, so a comparison against that inefficient baseline can exaggerate the apparent benefit. Normalize both sets of readings to equivalent output.
A good measurement boundary tells you whether savings are real, whether power quality is eroding them, and whether a fault or degraded cooling is hiding inside the drive.
How to Maximize Variable Speed Drive Efficiency Step by Step
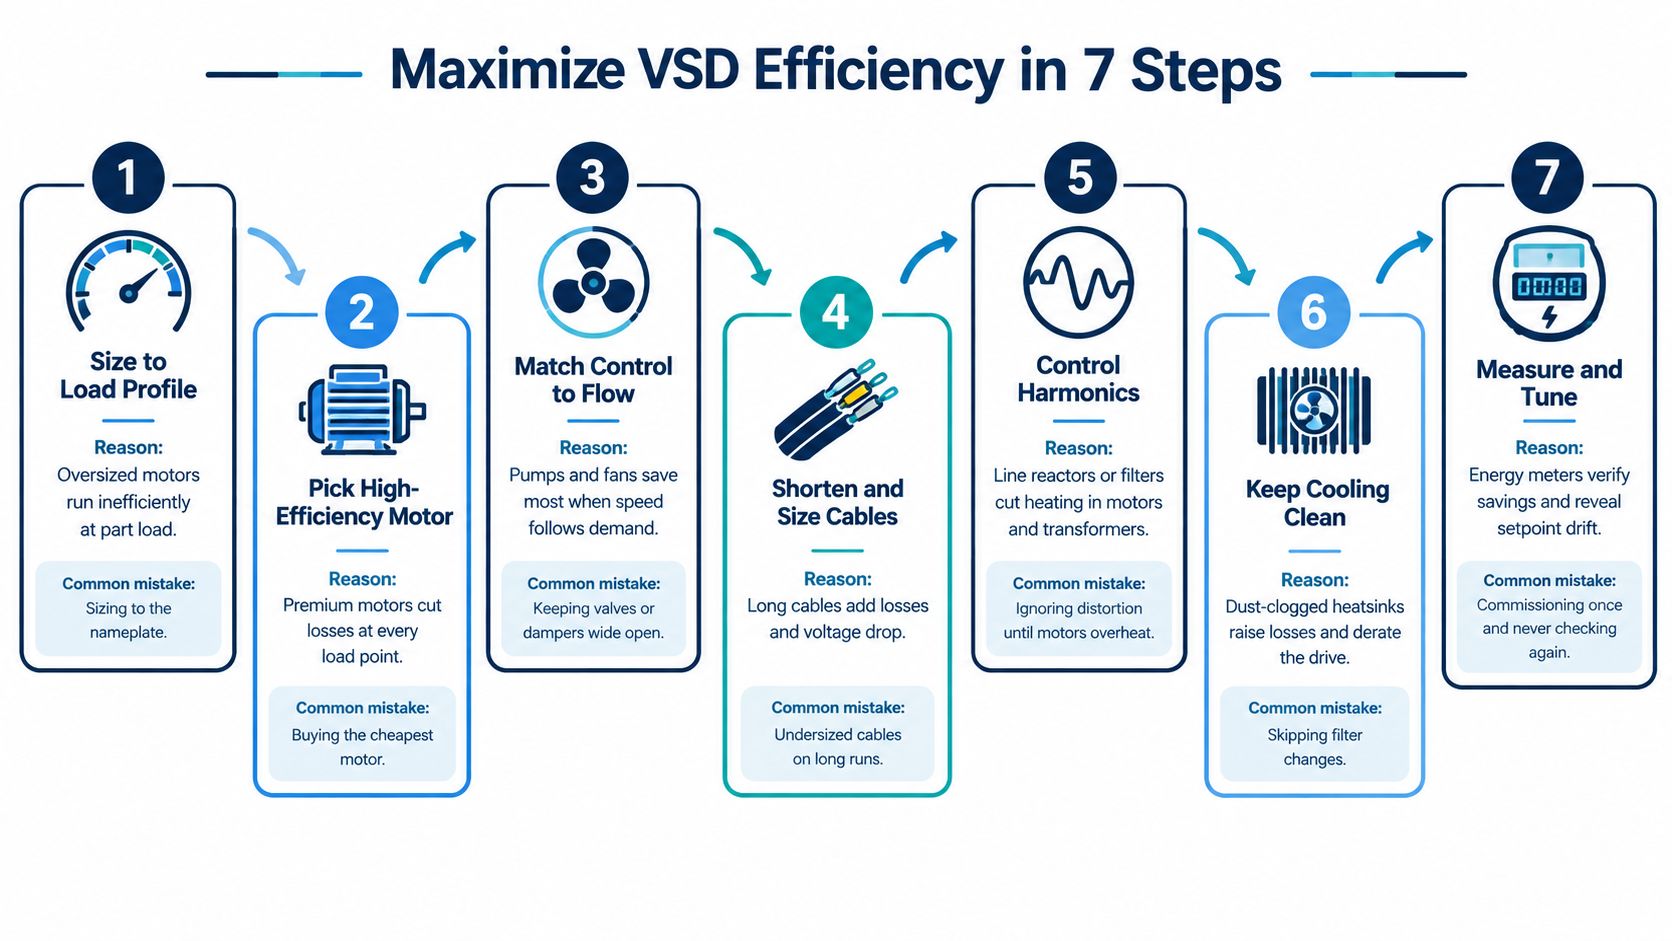
Efficiency improvements work best in commissioning order. Start with the load and process, then tune control and check the electrical and thermal details. Changing parameters before confirming the actual load can make a drive run smoothly while still wasting power.
-
Size to the measured load profile. Match the drive and motor to real duty rather than the nameplate alone, because oversized equipment may operate inefficiently at part load. The common mistake is selecting capacity from the motor rating without checking its normal load.
-
Choose a control mode that suits the load. V/f control suits straightforward variable-torque pump and fan duties; sensorless vector control is useful when starting torque or low-speed holding matters. The mistake is choosing a more complex mode without a process need, or using a basic mode where torque control matters.
-
Enter motor data and tune the operating limits. Program the motor nameplate values, run autotuning when appropriate, and set minimum speed and sleep/wake levels so a pump doesn't idle needlessly at low flow. Keep carrier frequency no higher than the application requires, because switching losses rise with it. The common slip is leaving default limits and settings in place.
-
Control flow with speed instead of throttling. For suitable pump duties, replace a control valve's restriction with a speed command tied to pressure or flow. Under the affinity laws, power for a centrifugal load falls approximately with the cube of speed, so 80% speed requires about 51% of full power under comparable conditions. A 2024 pipeline transportation study reported that replacing control-valve regulation with VFD-based pump control could reduce energy consumption by up to 6% at a single station (the 2024 pipeline study). The mistake is installing speed control without confirming that the process can tolerate the changed operating point.
-
Keep the cooling path clear. Clean heatsinks and filters, check fan operation, and inspect DC capacitors as part of scheduled care. A workshop repair can include power- and control-circuit diagnosis, cooling-path cleaning and inspection, component-level repair or replacement, and parameter backup and restoration where feasible. The common slip is cleaning the cabinet exterior while leaving internal airflow blocked.
-
Check motor cable length and condition. Respect the drive's cable limits and use line or output reactors where measured electrical effects cause motor heating or insulation stress. Undersized or poorly routed long cables can create voltage drop and installation problems. Don't add reactors automatically; confirm the issue first.
-
Back up settings and repeat the measurements. Save parameters after changes, then check energy per unit of output on a recurring schedule. A drive that was commissioned once can drift from the process as setpoints and equipment conditions change.
If energy per unit of output falls while drive temperature rises, check cooling and parameter settings first. Don't assume the efficiency gain is healthy just because the production meter looks better.
Real Savings Cases and What They Show
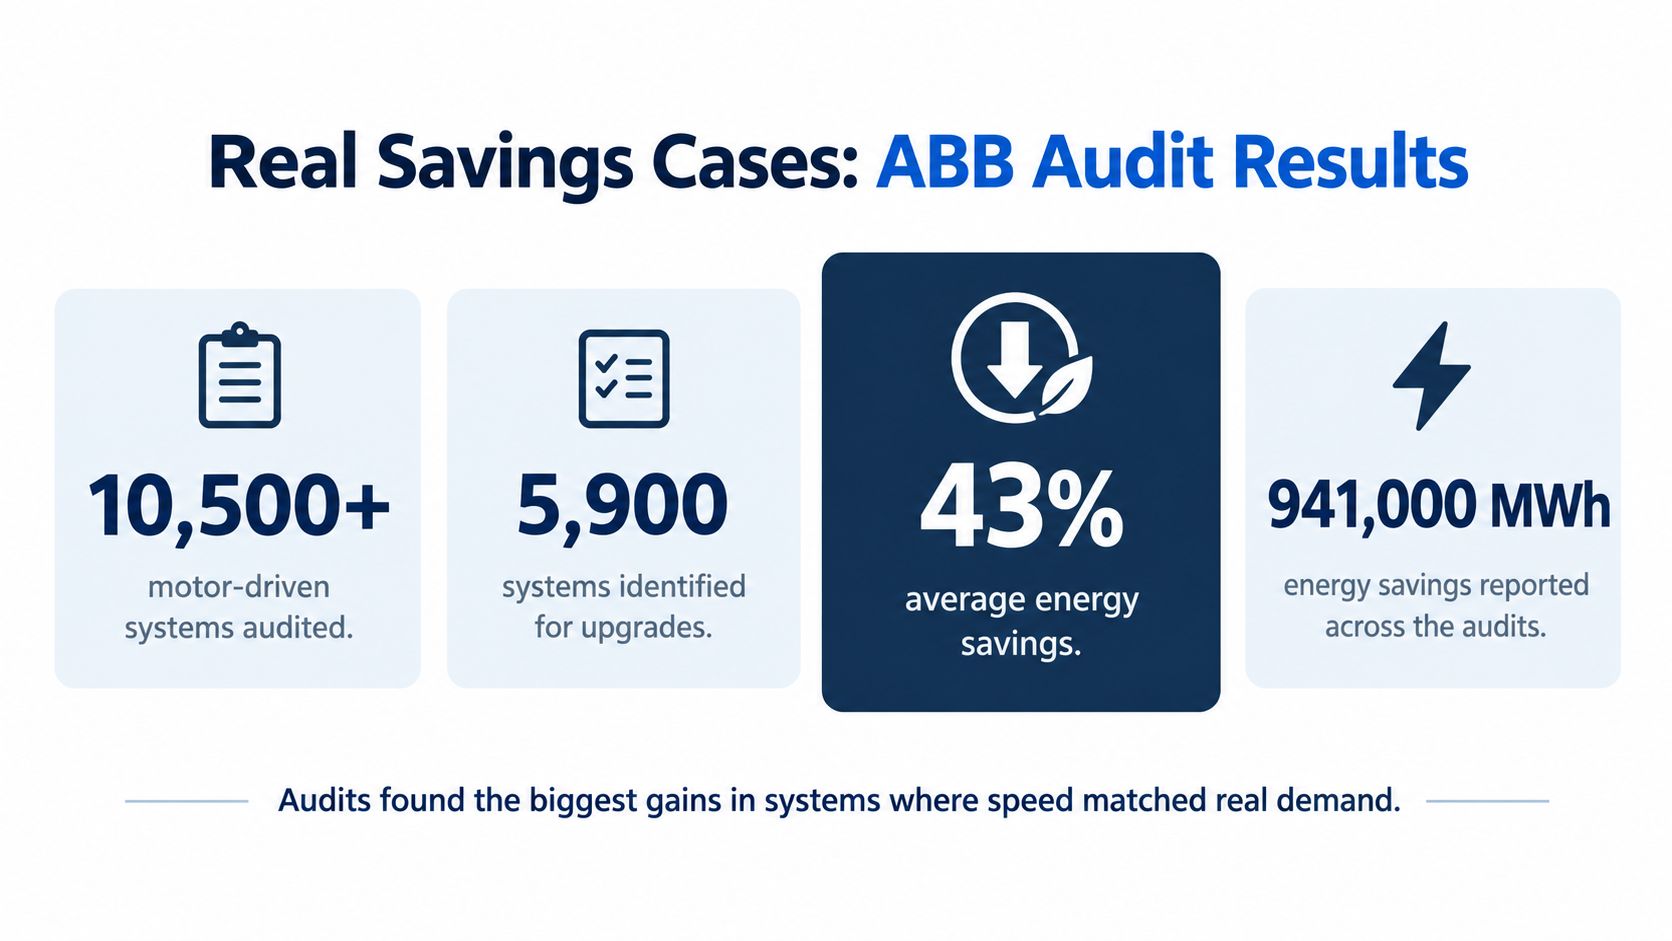
ABB audited more than 10,500 motor-driven systems, identified 5,900 for upgrades, and reported average energy savings of 43% and total savings of 941,000 MWh (ABB's reported motor-system audit results). The upgrades paired high-efficiency motors with VSDs, so the 43% describes the motor, drive and driven equipment measured together. A plant metering only the drive's terminals will record a smaller figure.
| Case | Intervention | Reported result and boundary |
|---|---|---|
| ABB motor-driven system audits (2025) | High-efficiency motors paired with VSDs | 5,900 systems identified for upgrades; 43% average energy savings and 941,000 MWh reported, measured across the whole motor system |
| Hangzhou Iron & Steel | Two-month maintenance contract and new inspection routines | Failures in a group of ABB drives aged 7–12 years fell from 2–3 per month to about one every six months; the result is a reliability figure |
| Shiheng Special Steel (2026) | Full maintenance cycle on 43 Siemens S120 drives | Delivered in under one month; the result is a serviceability and turnaround figure |
The three rows measure different things. The audit number aggregates savings at the system boundary, where motor losses and driven-equipment gains sit alongside the drive. The maintenance cases recover reliability and thermal margin in equipment already in service, so their value shows up on the failure log and in cooling headroom rather than on a kWh meter.
DUCHENG carried out the Shiheng work as a full maintenance cycle covering environmental assessment, parameter backup, deep dust removal, thermal silicone replacement, board cleaning, insulation varnish coating, DC capacitor replacement and component performance testing.
For compressor stations, the measurement boundary extends past the drive and motor to air demand and pressure control; variable speed drive selection for air compressors covers that application context.
The largest gains in these cases came from matching equipment to real demand and recovering condition in drives already installed. Every percentage quoted against a project should carry the same discipline: state what was metered, at which boundary, over what period.
Confirm the Savings Before Replacing a Drive
Before deciding to keep, recondition, or replace a drive, compare its measured input power with the expected value for the same process output. If the gap appeared after a heat or dust event, inspect the cooling path and check capacitor condition. Thermal and visual inspections can help separate a service issue from a drive that's no longer performing normally.
Next, measure harmonics at representative operating conditions and assess whether distortion is adding enough heat or reliability risk to justify reactors or filters. Don't buy mitigation hardware on the strength of one reading. Look for a consistent problem that links to operating conditions and equipment stress.
For an aging unit, assess which subsystems can be maintained or renewed before replacing the whole system. That staged decision can preserve serviceable equipment instead of treating age alone as a reason for changeout.
Decision rule: Maintain the drive when the gap comes from cooling, settings, or contamination. Consider mitigation hardware when harmonics dominate. Replace the unit when its core components are worn out and practical renewal can't restore serviceability.
Prepare a service request with the drive brand, exact model code, rated power and voltage, fault code exactly as displayed, when the fault occurs, and the operating environment. Send those details for diagnosis before deciding on a restart or replacement. DUCHENG assesses which parts can be maintained and refurbished when an aging drive system approaches the end of its service life.
DUCHENG Industrial provides multi-brand VFD commissioning, preventive maintenance, troubleshooting, workshop repair, and on-site reconditioning to help plants manage drive efficiency across the equipment lifecycle. If your readings show unexplained losses, rising temperatures, or recurring faults, visit DUCHENG Industrial to discuss a diagnostic or maintenance assessment.