
Quantify variable speed drive energy savings with logged baselines, realistic bands, ROI math, and checks when a drive does not pay.
The most popular advice about variable speed drives is also the easiest to misuse: reduce speed, apply the cube law, and book the saving. That isn't a defensible investment case. A drive changes how a motor operates, but the process, controls, and operating hours determine whether the plant buys less electricity.
Variable speed drive energy savings are an operating result, not a hardware specification. Build the case from measured input kW, compare energy at equivalent production, and prove the result again after commissioning. A project that can't survive those checks shouldn't reach finance with a guaranteed percentage attached.
Table of Contents
- Savings Bands You Can Defend by Application
- How to Measure a Production-Normalized Baseline
- How to Calculate Savings Before You Buy
- Worked ROI for Three Real Load Cases
- Control Choices and Limits That Decide the Saving
- Verify Savings Monthly and Act on Drift
Savings Bands You Can Defend by Application
The range worth taking into an initial screening meeting is an applicability range, not a promised saving. The IEA 4E motor-systems policy brief estimates that approximately 40%–60% of motor systems could benefit from properly applied variable-frequency drives, while coordinated motor-system improvements target roughly 20%–30% system-level energy savings. The same brief reports tested drive efficiencies generally ranging from 96% to 98%, averaging near 97.5%.
Those figures describe different things. Applicability tells you where to investigate; system savings include improvements beyond the drive; drive efficiency tells you that the electronics introduce a loss the application must earn back.
Match the existing control method first
Use this lookup before anyone opens a savings calculator. The claim column deliberately avoids application-specific percentages that can't be supported without a load profile.
Defendable variable speed drive savings bands
| Application | Mechanism | Energy change to claim | What voids the band |
|---|---|---|---|
| Centrifugal fan on a damper | Variable torque; speed replaces damper restriction | A candidate for substantial savings, quantified from the operating profile | High minimum airflow or operators locked at full speed |
| Throttled pump, low static head | Variable torque; reduced throttling | Positive only across hours with removable throttling | Recirculation or bypass left open |
| Pump dominated by static head | Limited usable speed reduction | Small or no saving until the system curve proves otherwise | Using the cube law without checking head |
| Compressor on unload or bypass | Reduced unloaded or bypass operation; not a pure cube-law application | Calculate from the compressor's package power and delivery map | Surge limit or a high minimum speed |
| Constant-torque or near-constant load | No automatic affinity-law benefit | No energy saving at unchanged output; include drive losses | Installing a drive for energy alone |
| Screened high-opportunity systems | Mixed applications selected for improvement potential | A screening benchmark, not an individual asset forecast | Treating a selected sample as a site-wide default |
| Market-wide average potential | Mixed motor uses and duty cycles | A portfolio estimate, not a machine guarantee | Ignoring hours and the actual load profile |
A nearly closed damper is a useful lead, but it isn't a meter. Check whether the fan spends meaningful operating time in that condition and whether the process can accept lower speed. A throttled pump deserves the same scrutiny: identify the pressure being wasted at the valve rather than assuming every pressure requirement disappears.
Set a conditional claim
A supervisor should be able to say: The opportunity exists while this restriction is active, this demand is below design, and this minimum operating limit isn't binding. That statement is more useful than a brochure percentage because operators can verify its conditions.
Keep sizing, control changes, and mechanical repairs visible in the project scope. If the team replaces an oversized pump and installs a drive together, the resulting saving belongs to the combined system project. Don't attribute the entire reduction to the drive and then reuse that percentage on another motor.
Practical rule: Carry an application-specific hypothesis into measurement, not a universal savings percentage.
How to Measure a Production-Normalized Baseline
File the baseline before the purchase order. After startup, nobody should have to reconstruct old valve positions, production conditions, or bypass hours from memory.
The measurement sequence needs a consistent electrical boundary and a process record that operations already trusts.
Establish the boundary and normalizer
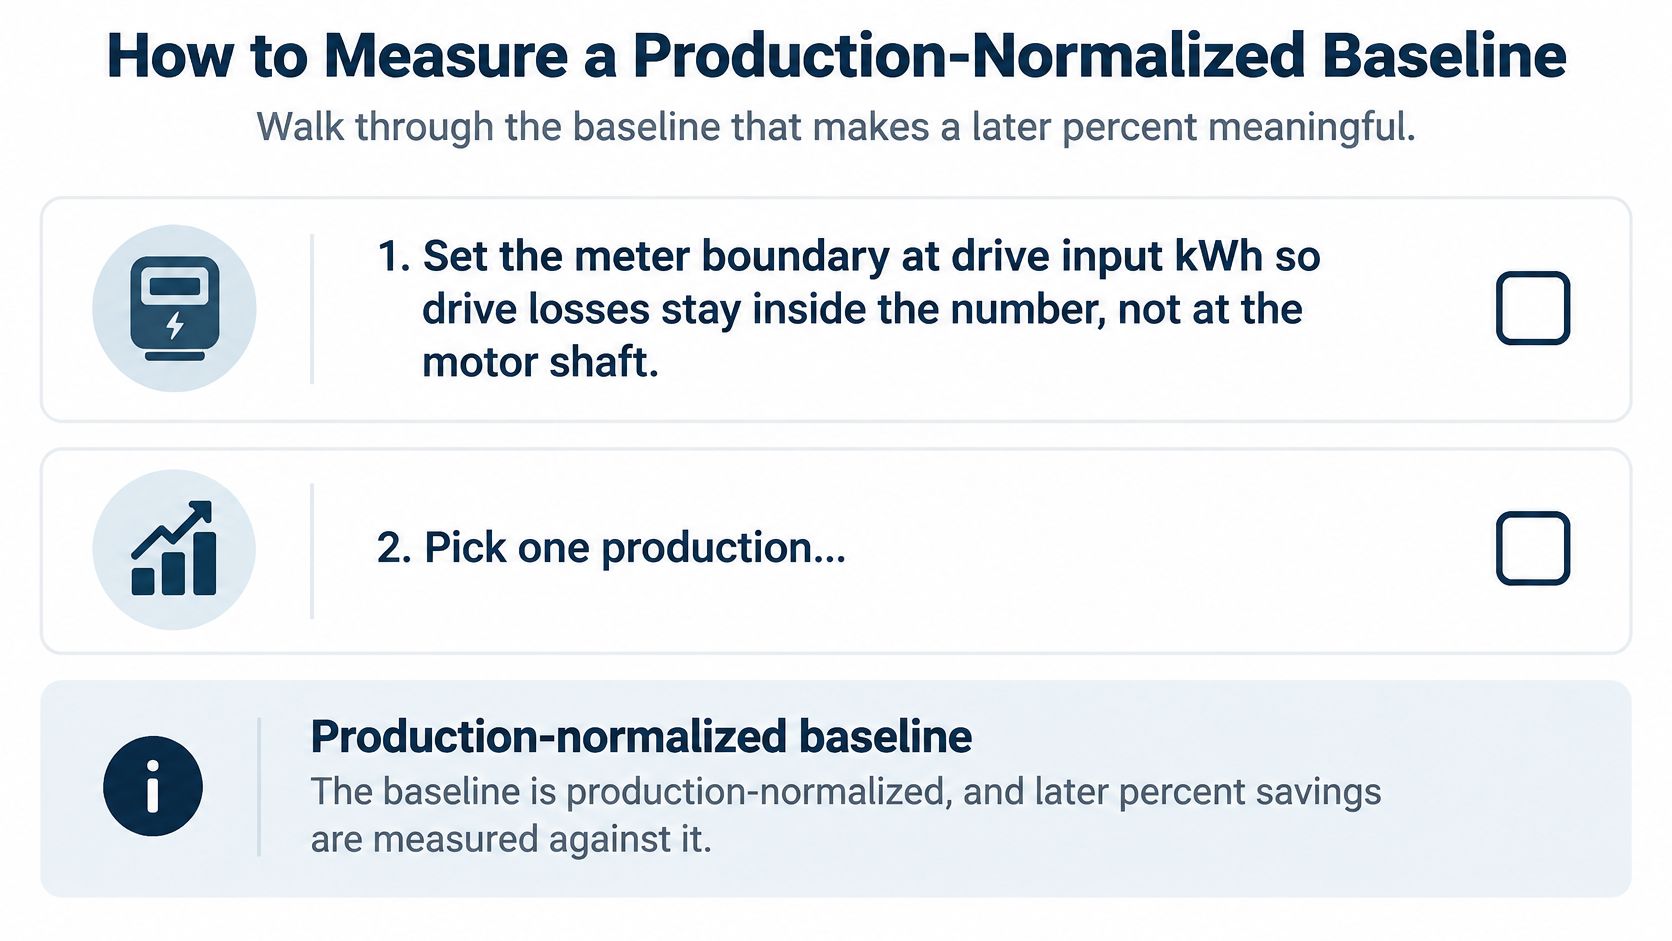
Have qualified electrical personnel install a true-power logger at the existing starter input. After the retrofit, meter at the drive input using the same system boundary, so the comparison includes the drive's losses. If auxiliaries or parallel equipment materially affect the project, explicitly include or exclude them on both sides.
Choose a production normalizer that describes useful output: tonnes processed, liquid volume delivered, or another accepted production measure. Where output isn't readily metered, use operating hours within clearly defined load bins. Don't substitute motor runtime for production if idle operation consumes significant energy.
Capture representative high-load, low-load, and idle conditions. Extend logging until the record includes the normal operating cycle; a shutdown period or a single spot-kW reading won't describe annual duty.
Record the conditions that explain changes:
- Process duty: Product grade, batch type, required flow, pressure, and temperature.
- Equipment arrangement: Which parallel machines ran and which bypasses were available.
- Control state: Automatic, hand, fixed-speed override, or bypass starter operation.
- External conditions: Weather or seasonal factors that materially affect demand.
Freeze an auditable sheet
Keep the working record short enough that maintenance and finance will both use it.
| Baseline field | What to retain |
|---|---|
| Electrical measurement | Meter location, logged kWh, and interval input kW |
| Useful output | Production quantity and its measurement source |
| Specific energy | Input kWh divided by production units |
| Operating condition | Speed or restriction position, process variable, and control mode |
| Exceptions | Downtime, bypass operation, abnormal product runs, and missing readings |
| Accountability | Asset identification, measurement dates, and approving owners |
Use a regression of energy against production when the relationship supports it. Include a weather term, such as degree-days, when weather materially changes the duty. Inspect the relationship rather than forcing a straight line through operating regimes that behave differently.
After commissioning, collect the same fields and calculate the baseline energy expected for the post-startup production and conditions. Compare actual energy against that adjusted expectation, and report both the energy reduction and the change in specific energy.
A lower electricity total isn't proof of efficiency if the plant simply produced less.
Document non-routine changes separately. An impeller trim, revised pressure policy, relocated meter, or transfer onto a bypass starter changes the comparison. Keep those changes visible instead of absorbing them into the claimed drive saving.
How to Calculate Savings Before You Buy
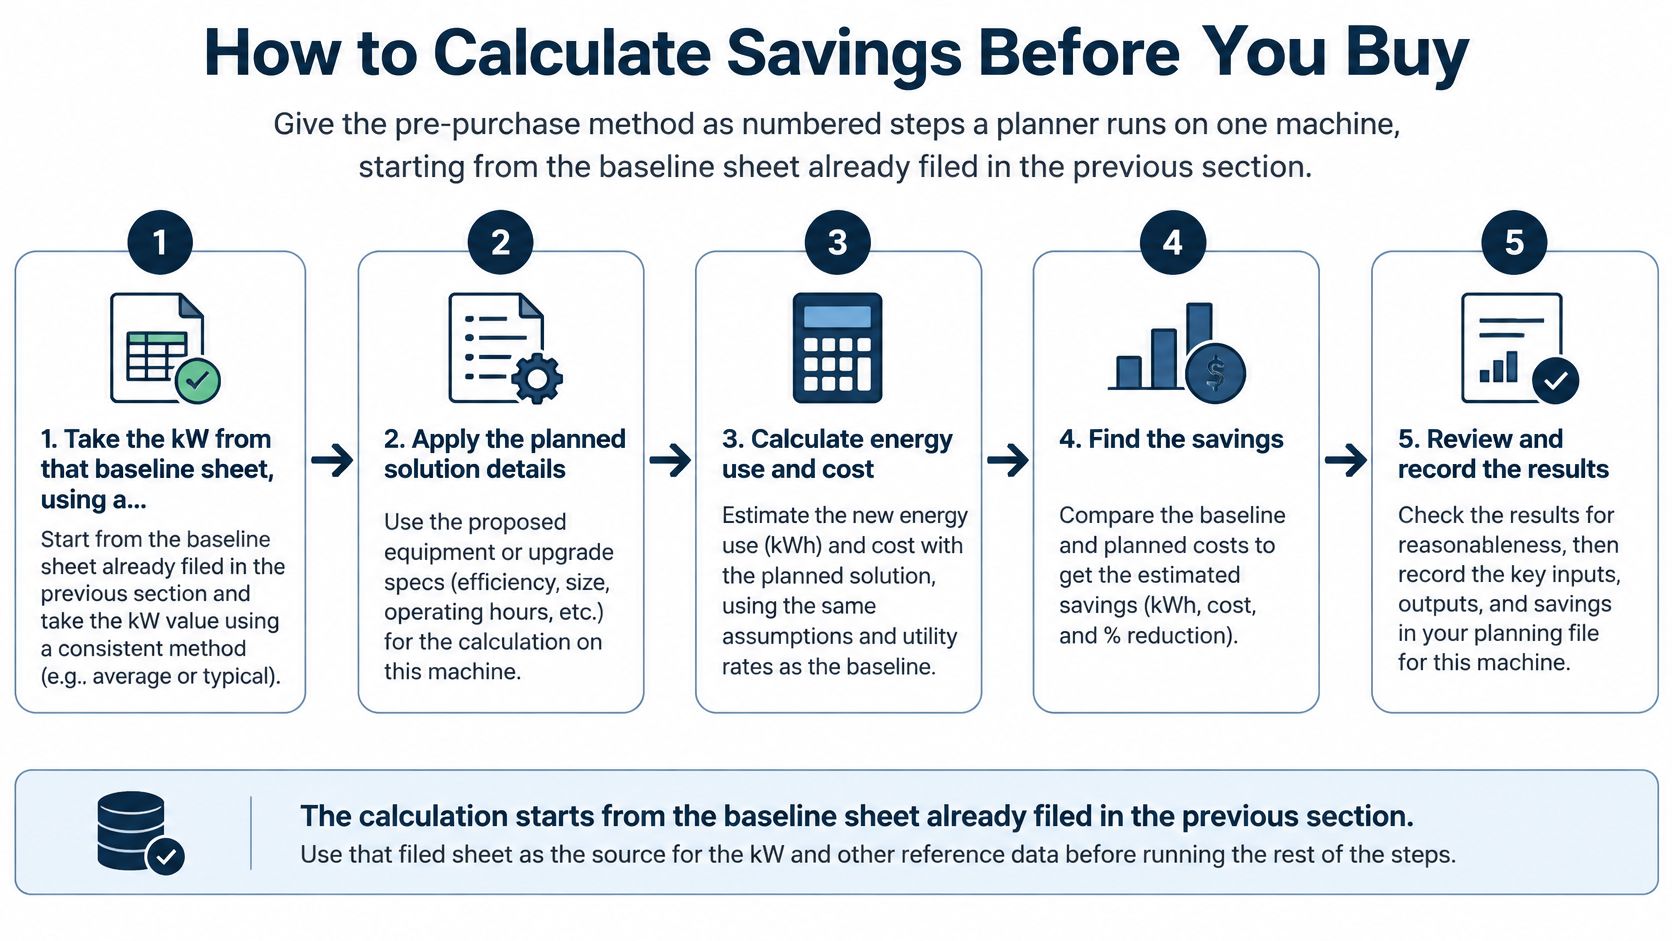
Start with the filed baseline sheet, not the motor nameplate. Nameplate power describes motor capability; it doesn't establish what the plant currently consumes or what a speed-control retrofit can remove.
The Fraunhofer/CEMEP study estimated 10%–75% per-unit savings, but only 2%–30% market-wide average potential. Those aren't interchangeable forecasts: application selection and load-cycle assumptions materially change the result.
Use the following planning sequence to turn a promising machine into a testable proposal.
Build the operating model
-
Take true input kW from the baseline. Use the logged electrical power for each operating state. Don't calculate the baseline from horsepower, full-load amps, or drive current alone.
-
Identify the restriction the project removes. Record damper position, valve position, bypass flow, or recirculation alongside the required process output. Valve position alone isn't a measurement of hydraulic loss, so capture pressure information where practical.
-
Bin the operating hours by duty. Separate high demand, reduced demand, idle, and constrained operation. Put flow or pressure beside each bin, along with its measured baseline power and expected annual hours.
-
Test the proposed speed against the system. For suitable centrifugal fans and pumps, the affinity-law hypothesis is:
Power ratio ≈ speed ratio cubed
This relationship describes similar operating points, not every point on an installed system curve. Use equipment curves and the required head to establish achievable duty before assigning projected input power.
-
Include electrical losses explicitly. Estimate motor input at the proposed operating point, then divide it by the applicable drive efficiency to obtain drive input. Use efficiency information relevant to the expected loading, not only the rated operating point.
-
Apply operating constraints to the hour bins. Minimum-flow duty, safety sequences, fixed-speed production modes, and bypass operation need their own projected power. Don't credit reduced-speed savings during hours when the controls won't permit reduced speed.
-
Sum the result at equivalent output. Calculate annual baseline energy and projected energy from the same duty assumptions. Their difference is projected annual kWh saved.
Make the calculation reviewable
Use these relationships in the worksheet:
Bin energy = average input kW × hours in that bin
Annual energy saved = adjusted baseline kWh − projected input kWh
Specific energy = input kWh ÷ useful production units
If the baseline uses measured motor input and the model estimates shaft power, reconcile that boundary before subtracting anything. Mixing shaft power with electrical input can make a modest project appear attractive.
For compressors, use package performance at the required delivery conditions instead of borrowing a fan calculation. The operating-state distinctions in variable speed drive compressor applications help frame the review around loaded, unloaded, and constrained operation.
The video provides another way to review the drive concept before finalizing the worksheet.
<iframe width="100%" style="aspect-ratio: 16 / 9;" src="https://www.youtube.com/embed/ESm7Daql4Cc" frameborder="0" allow="autoplay; encrypted-media" allowfullscreen></iframe>Run conservative and expected operating cases. If the proposal only works when operators never use an existing override, the control changes belong in the scope and cost.
Stop buying for energy when the predicted net benefit is indistinguishable from electrical-loss uncertainty and measurement uncertainty. A drive might still be justified for process control or starting performance, but finance should see that as a different investment case.
Worked ROI for Three Real Load Cases
Illustrative annual energy and cost by load case
The following are hypothetical operating scenarios, not field results or market tariffs. Each assumes equivalent useful output before and after the retrofit; the savings fractions are explicit modeling assumptions.
| Case | Baseline | Net energy change | Illustrative annual cost |
|---|---|---|---|
| Supply fan, 75 kW class, assumed measured input 60 kW, damper today | 60 kW × 6,000 hours = 360,000 kWh | Assumed 35% net reduction = 126,000 kWh saved | At an assumed $0.12/kWh, $15,120 saved |
| Water-transfer pump, 45 kW class, assumed measured input 40 kW, high static head | 40 kW × 7,500 hours = 300,000 kWh | Assumed 8% net reduction = 24,000 kWh saved | At an assumed $0.10/kWh, $2,400 saved |
| Mixer, 22 kW class, assumed measured input 18 kW, unchanged speed and duty | 18 kW × 5,000 hours = 90,000 kWh | Assumed 2.5% input-energy penalty = 2,250 kWh extra | At an assumed $0.12/kWh, $270 extra |
Read the mechanisms behind the arithmetic
The fan represents a credible candidate when a damper restricts output for much of the operating cycle. Its assumed net saving already includes drive losses, so don't subtract those losses again. The remaining engineering question is whether the proposed speed schedule maintains required airflow and pressure.
The pump represents a constrained opportunity. Static head remains even when friction losses fall, so its assumed reduction is deliberately modest. A water-transfer application makes that distinction clear; don't assume building elevation creates equivalent static head in a closed circulating-water loop.
The mixer has no energy payback under the stated assumptions. With speed and useful duty unchanged, the project adds consumption rather than removing it. If variable speed enables a shorter mixing cycle or a different production method, evaluate that as a separate process change and verify product quality.
For context, ABB reported in 2025 average identified energy savings of 43% across 5,900 prioritized and appraised systems, from an assessment covering more than 10,500 industrial motor-driven systems. That's a selected-system assessment result, not the forecast for the fan, pump, or mixer in this table.
Convert energy into an investment decision
Simple payback = total installed cost ÷ annual net cash savings
Don't insert a guessed drive price. Obtain the installed scope, including electrical work, enclosure and cooling, sensors, controls integration, protection, engineering, commissioning, and production interruption where relevant. Account for additional recurring costs when calculating annual net cash savings.
Use the tariff applicable to the operating hours when energy is avoided. Keep any demand-charge benefit separate unless the project demonstrably reduces the billed peak; reducing a machine's average kW doesn't automatically establish that result.
A typical plant shouldn't be assigned a single case. A variable-air-volume utility may resemble the fan, a transfer duty may resemble the constrained pump, and a continuous production machine may resemble the mixer.
Reject a proposal that starts with nameplate kW and a generic percentage. Ask for logged input power, duty hours, useful output, and the proposed control sequence in the same worksheet.
Replace every assumed value with the asset's logged value before approval. The arithmetic can remain simple even when the operating analysis needs care.
Control Choices and Limits That Decide the Saving
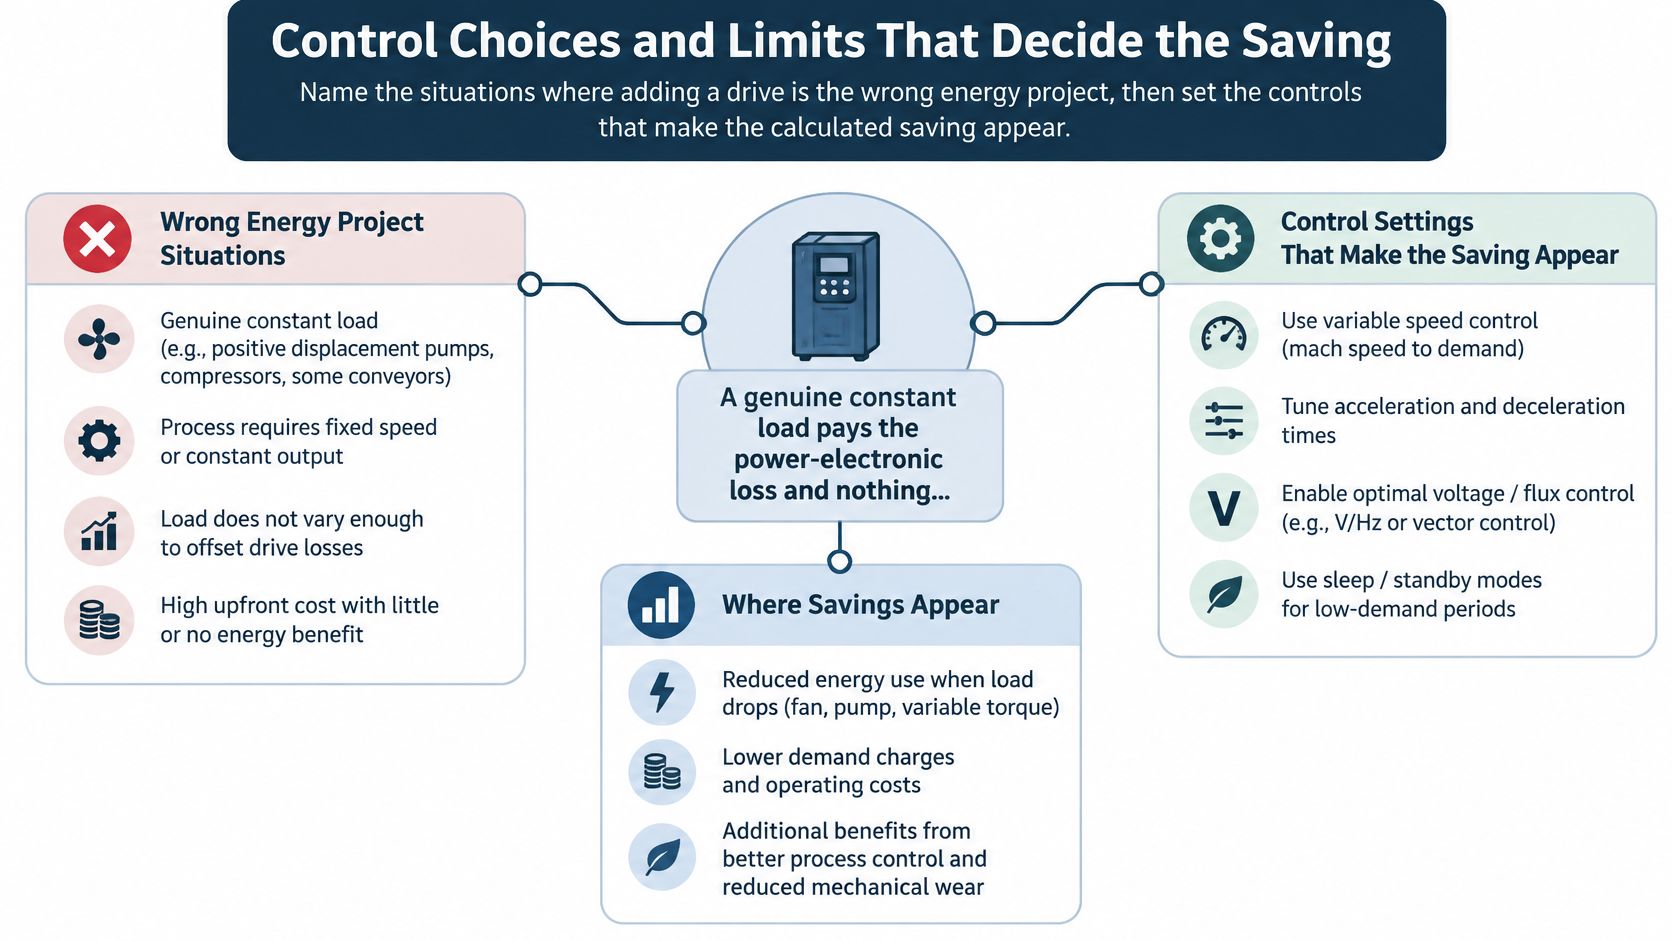
A drive is the wrong energy project when the process needs the same speed and output throughout its operating cycle and the retrofit removes no other loss. Don't use an energy budget to justify a control upgrade that can't reduce input energy at equivalent production.
A European pump-and-fan modeling paper estimated 19.6 TWh/year of potential savings, equal to 4.05% of pump and fan electricity use, primarily through improved equipment sizing and selection rather than speed reduction alone. That supports a practical purchasing order: examine the driven equipment and duty before assuming a drive is the best correction.
Remove constraints without removing protection
Limits that erase variable speed drive savings
| Condition | Energy effect | What to do |
|---|---|---|
| Constant speed and constant load | Drive losses increase input consumption | Don't install for energy alone |
| High static head and little throttling | Simple cube-law modeling overstates the opportunity | Recheck equipment selection and system duty before considering resizing or impeller trimming |
| Minimum flow almost equal to design flow | Little usable speed reduction remains | Validate the requirement and redesign only where equipment protection permits |
| Bypass or recirculation left open | Unnecessary circulation can remain | Close or interlock unnecessary bypass paths without defeating minimum-flow protection |
| Operators lock the drive at full speed | Reduced-speed hours disappear | Investigate the reason, then control and alarm unauthorized overrides |
| Untuned loop or badly placed sensor | Output hunts or saturates | Correct sensor representation and retune before scoring savings |
| Fault forces operation on a bypass starter | The planned speed-control sequence isn't active | Restore and verify closed-loop operation |
Impeller trimming isn't an automatic answer to high static head. Confirm the required duty and pump curve first, because trimming also reduces available head. Likewise, a minimum-flow line may be protecting a pump or process exchanger; closing it merely to improve the energy number can create a reliability problem.
The control sequence must show where equipment protection takes priority and how much operation that constraint permits. Record legitimate safety overrides separately from avoidable hand-mode operation.
Use this control map to distinguish a poor energy candidate from a correctable operating problem.
Control the process variable
Put the PID loop on the variable the process needs: flow, differential pressure, duct static pressure, temperature, or another defined requirement. Motor current is useful for diagnostics and protection, but it isn't a substitute for measuring useful output.
Position the sensor where it represents the critical demand. For a distribution system, that may mean a downstream or remote location rather than the pump discharge or fan outlet. A pressure sensor close to the machine can report a satisfied local condition while the distant user remains underserved.
Set minimum speed from documented limits for flow, lubrication, motor cooling, stability, and equipment operation. Verify each limit against manufacturer requirements and actual system behavior. Do not lower a protective limit just because the energy model appears better.
Stop competing loops from fighting each other. If a valve controller throttles flow while the drive controller raises pressure, the team may retain the original loss while adding unstable control. Define which controller owns capacity and which devices provide distribution or protection.
For pump-specific curve, sensor, and sequencing considerations, use the VFD for pump application guidance when preparing the functional test.
Make the sequence survive operator use
Stage parallel machines against actual demand rather than running every unit at a restricted duty. Test transitions between lead and lag equipment, including the response when a unit becomes unavailable. Keep the selected sequence consistent with the equipment's permissible operating region.
Define hand mode, override authority, and the route back to automatic operation. Alarm when the machine remains at maximum command while the process variable is already satisfied, but distinguish that condition from genuine high demand.
Before accepting the project, match the approved sequence to the installed parameters:
- Controlled variable: Confirm the sensor, engineering units, setpoint, and failure response.
- Minimum speed: Record the protective reason and test the permitted operating floor.
- Sensor location: Confirm that the measurement represents the limiting process demand.
- Staging rule: Test machine combinations and transition behavior.
- Override alarm: Verify detection, ownership, acknowledgement, and return to automatic control.
Don't claim savings while these items remain unresolved. Stable process delivery is part of acceptance, not a separate concern to address after the energy report.
Verify Savings Monthly and Act on Drift
Publish the accepted post-startup specific energy beside the frozen baseline and review it monthly. Keep production, adjusted baseline energy, actual energy, and operating exceptions together so the reviewer can distinguish a maintenance problem from a change in duty.
Trend input kW, actual speed, and the controlled process variable on the same time axis. Add control mode and bypass status where available. A power trend without process context can't tell the team whether the machine is inefficient or doing more work.
Treat deterioration as a maintenance event
An increase in kWh per production unit should trigger an investigation, not an immediate rewrite of the savings claim. Start with the operating records and physical condition.
- Full-speed operation: Check hand mode, sensor plausibility, setpoint changes, and whether demand genuinely increased.
- Cooling and contamination: Inspect cabinet airflow, filters, cooling fans, and thermal alarms.
- Electrical condition: Investigate power-quality concerns with suitable instrumentation rather than assigning unexplained consumption to harmonics.
- Configuration changes: Compare parameters and control logic with the approved backup after a board replacement or restoration.
- Process restrictions: Check strainers, filters, valves, and altered equipment arrangements that change required power.
Assign each alarm an owner and a response. An alarm that operators routinely acknowledge without action won't preserve the operating conditions used in the investment case.
Keep an honest savings record
Each quarter, review the production regression and adjust expected baseline energy for current conditions. If the plant now operates outside the original model's valid range, qualify the result and extend the measurement rather than extrapolating confidently.
Investigate departures from the approved savings band, but report the measured result even when it's disappointing. Don't limit the report to periods that support the purchase decision, and don't retrospectively lower the baseline to conceal deterioration.
At DUCHENG Industrial, our multi-brand lifecycle work covers commissioning, preventive maintenance, emergency troubleshooting, workshop repair, and on-site reconditioning. These activities support the same operational requirement: keeping the drive capable of executing the approved sequence.
File a concise handover with the asset record: the frozen baseline sheet, monthly specific-energy log, approved parameter backup, and alarm list with named owners. After a repair or control change, verify operation against that record before treating the energy performance as restored.
DUCHENG Industrial provides multi-brand VFD commissioning, maintenance, troubleshooting, repair, and on-site reconditioning to support reliable speed-controlled operation. Visit DUCHENG Industrial to discuss your drive application, bringing the baseline sheet, operating trends, and control sequence so the review starts with measurable performance rather than a promised percentage.