
What is MTBF? Learn the formula, a worked VFD example, how to read the number for reliability planning, and where it misleads.
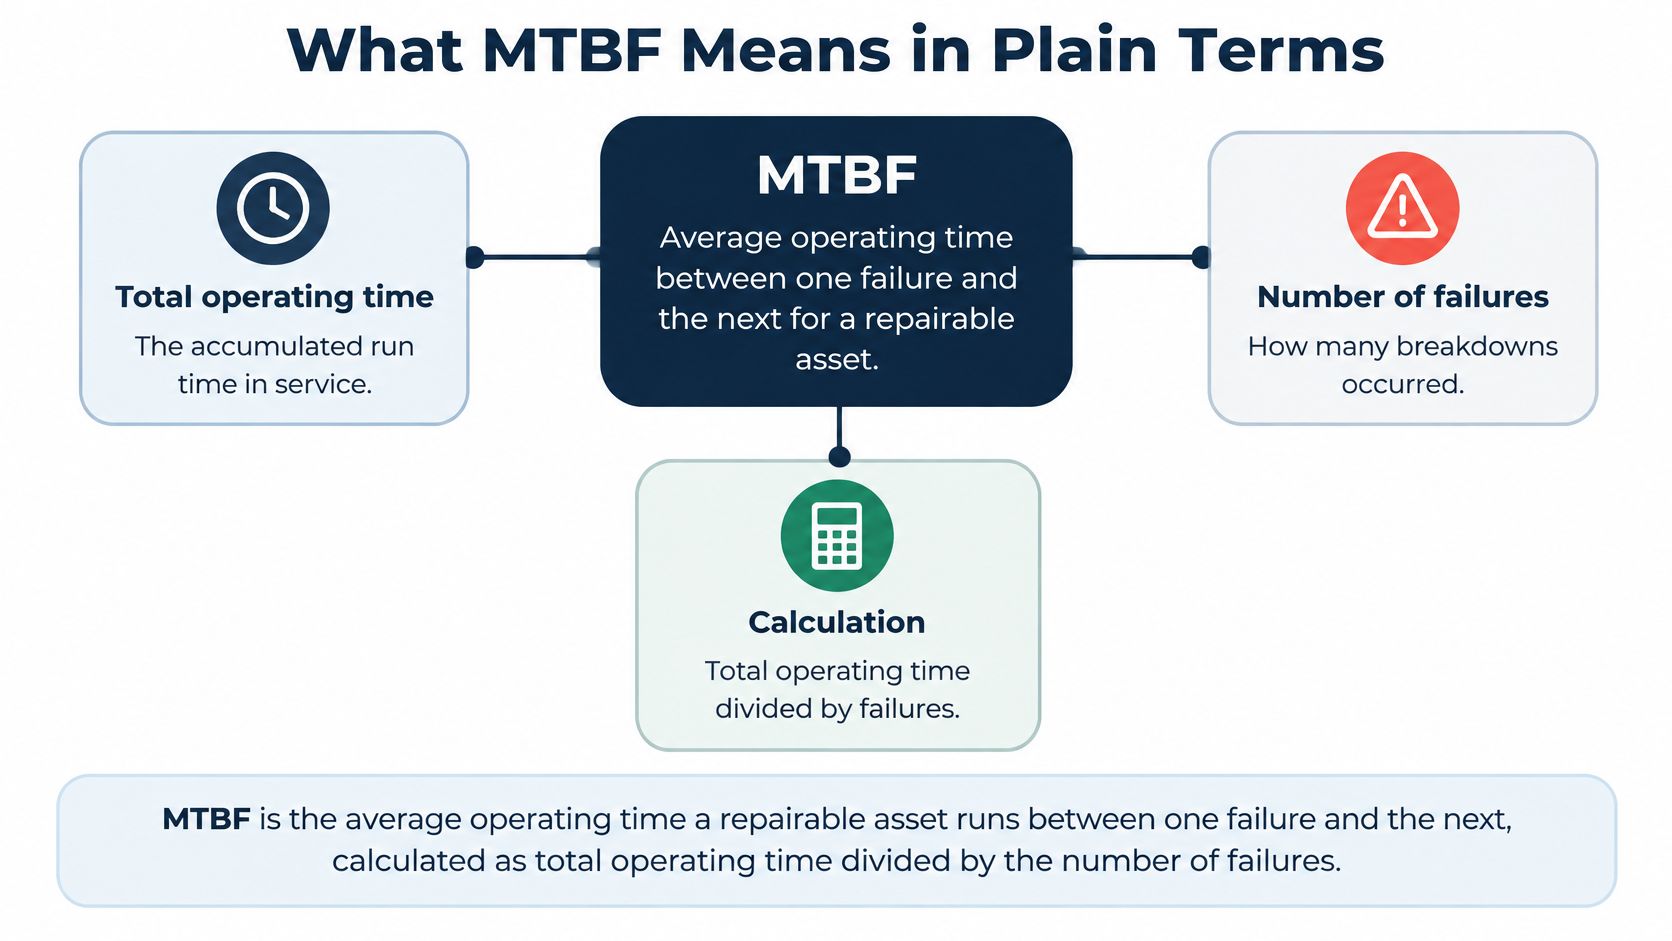
MTBF, or mean time between failures, is the average operating time a repairable asset runs between one failure and the next, calculated as total operating time divided by the number of failures. It's an average built from exposure and events, so it describes a pattern across a fleet rather than the life of any single unit.
A maintenance manager sends a short note before the quarterly review. Two production lines run the same drive model, installed the same year, on the same duty. One site reports a healthy MTBF. The other reports roughly a quarter of that figure. Nobody changed the drives. What changed is what each site counted as a failure, and which hours each site put in the denominator.
That gap is where most confusion about the metric starts. The formula is one division. The judgement sits in the two inputs and in what you do with the answer afterward. Once you can see those parts clearly, the number stops being a datasheet boast and becomes a working tool for spares, inspections and shutdown planning.
Table of Contents
- What MTBF Means in Plain Terms
- How to Calculate MTBF Step by Step
- How Many Failures Make an MTBF Trustworthy
- Turning MTBF into Reliability Planning Numbers
- What MTBF Cannot Tell You About Drive Life
- Using MTBF in VFD Asset Management
- Set Up an MTBF Baseline for Your Drives
What MTBF Means in Plain Terms
MTBF = total operating time ÷ number of failures. Two inputs, and most plants keep them in different systems that never meet.
A city bus runs 300 hours in a month and breaks down three times. Divide 300 by 3 and the route averages about 100 hours between breakdowns. That figure describes a pattern across many trips. It doesn't tell the dispatcher when the next breakdown lands, and it doesn't promise that any single bus will reach 100 hours before it stalls.
Read a drive the same way. MTBF belongs to repairable assets, the things a technician fixes and puts back into service: VFDs, pumps, fans, gearboxes. Items you throw away and replace, such as a fuse or a single-use sensor, belong to MTTF, mean time to failure, where the question is how long the part lasts rather than how long it runs between repairs.
Plants track it because it does three jobs nothing else does as cheaply:
- It collapses a year of trip logs into one comparable number. Twenty drives with different run hours become a ranked list instead of a pile of alarms.
- It shows direction. A group that ran 9,000 hours between trips last year and 4,500 this year is telling you something changed, whether that's a batch of spares, a new load profile or a cooling problem.
- It sizes decisions. Spare holding, inspection frequency and the case for a rebuild all get easier when you know how often failures arrive.
Work through a drive and the arithmetic stops being abstract. A 75 kW VFD trips twice across 17,520 operating hours, which is two years of continuous running. Divide the hours by the trips and the MTBF is 8,760 hours, an average of one failure per year of service across the group you measured.
Before you trust any figure of your own, ask a plain question: can your current trip log show energized run hours and failure dates clearly enough to produce that division at all? If the answer is no, the number you've been quoting came from somewhere other than your plant.
How to Calculate MTBF Step by Step
The division takes a second. Nearly every misleading MTBF figure comes from the two inputs, so build those first and the answer looks after itself.
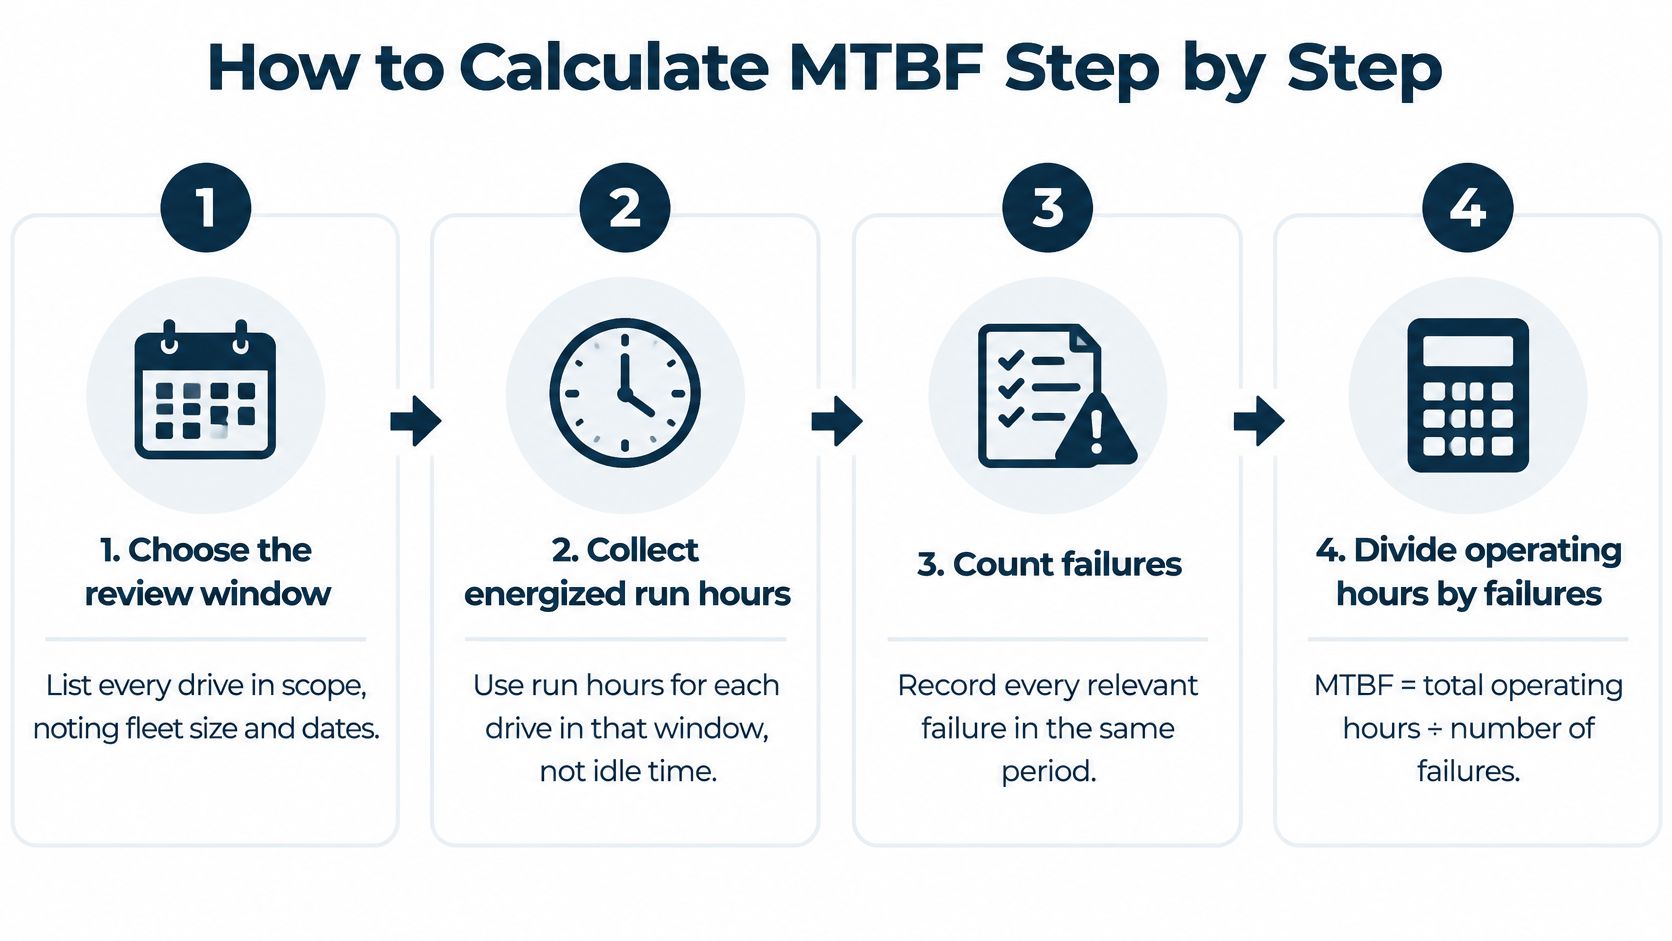
- Choose the review window and list every drive in scope. Pick a quarter, half year or full year and apply the same dates to every unit. Record the fleet size alongside it, because a fleet number and a single-drive number look identical on a slide while answering completely different questions.
- Collect energized run hours for each drive inside that window, not calendar hours. A standby drive on a booster set can sit idle for weeks, and counting those weeks makes the fleet look calmer than it is. Pull hours from the drive's run-time counter or the controller log, then subtract planned shutdowns.
- Count failures over the same dates using a rule your team wrote down first. Decide in advance whether a self-clearing nuisance trip, a communication fault or a protective shutdown counts as an event. Changing the rule halfway through the window turns a trend into noise.
- Divide total run hours by the failure count. Ten drives at 8,000 hours each is 80,000 hours of exposure; four failures across them gives an MTBF of 20,000 hours.
- Convert the result into failures per drive per year by dividing 8,760 by the MTBF. At 20,000 hours that's about 0.44 failures per drive per year, so a fleet of ten expects a little over four trips a year. That's the shape of the number a spares and labour budget can hold.
Two slips cause most of the damage. Mixing calendar hours with run hours inflates MTBF, sometimes by a factor of three on lightly loaded equipment. Mixing a single drive's history with a whole fleet's exposure produces a figure that belongs to neither.
| Scenario | Failures | MTBF (hours) |
|---|---|---|
| 10 VFDs, 8,000 run hours each | 4 | 20,000 |
| 1 VFD over 3 years (26,280 h) | 1 | 26,280 |
| 20 VFDs, 8,760 run hours each | 2 | 87,600 |
| 5 VFDs, 4,000 run hours each | 0 | Not calculable |
The first row is the fleet case: 80,000 hours of shared exposure with four events. The second is a single drive over three years of continuous running with one repair. The third has more than twice the exposure of the first and half the failures, so the 87,600-hour result is arithmetically correct and statistically fragile.
The fourth row is where people go wrong. MTBF cannot be calculated without a failure. Twenty thousand hours of clean running tells you the window was too short or the drives are young. Write "not yet calculable" and extend the window. Never write infinity.
If you'd rather watch the arithmetic than read it, the walkthrough below follows the same steps.
<iframe width="100%" style="aspect-ratio: 16 / 9;" src="https://www.youtube.com/embed/n71u7e2uVN0" frameborder="0" allow="autoplay; encrypted-media" allowfullscreen></iframe>One more caution before you publish anything. With two failures, adding a third cuts the average by a third. With one failure, a second event halves it. Show the failure count next to every MTBF value and label anything built on one or two events as provisional.
How Many Failures Make an MTBF Trustworthy
An MTBF built on two failures is a rough signal wearing the costume of a measurement. The math is exact; the sample behind it is thin enough that ordinary variation moves it more than any real change in reliability.
Pooling helps when it's done carefully. Drives of the same voltage class, duty cycle and environment can be combined over a longer window to build a bigger event count, but only if the failure rule and the run-hour basis are identical across the pool. A longer window carries its own trade-off, because it starts mixing drives installed years apart, and the average then describes an aging profile that no current unit has.
Report the pair, never the average alone. An MTBF of 26,280 hours from one failure and the same figure from forty failures are not the same claim, even though they read identically on a dashboard.
Before acting on any change, compare the failure counts in the two periods and ask whether the difference is larger than the month-to-month variation you normally see in that fleet. A move from four failures to three across a year is weather. A move from twelve to four is a pattern.
The planning consequence matters more than the statistics. A provisional value should buy you a review date and a data cleanup, not a pallet of spare modules.
Turning MTBF into Reliability Planning Numbers
An MTBF on its own is awkward to plan with. Convert it into a probability, or into expected failures across a fleet, and it starts answering questions about spares, staffing and shutdown windows.
From hours to a probability
The conversion assumes a constant failure rate, the same assumption sitting behind most quoted MTBF figures. Under it, the chance a drive runs for a period t without failing is e to the power of minus t divided by MTBF, and the failure rate is 1 divided by MTBF.
| MTBF (hours) | 3 years (26,280 h) |
|---|---|
| 20,000 | 27% |
| 50,000 | 59% |
| 100,000 | 77% |
Start with the top row. A drive rated at 20,000 hours has a 27% chance of running three straight years without a failure, so roughly three in four will trip at least once in that window. At 100,000 hours the chance rises to 77%, which is better and still a one in four chance of an unplanned stop before year three ends.
The middle row catches people out. At 50,000 hours, one year of continuous running comes out around 84%, which sounds reassuring. Stretch the horizon to five years and it falls to about 42%. The rating didn't change. The exposure did.
Sizing a fleet
Single-drive probabilities matter less than fleet totals when you're buying parts or staffing a shift. Expected failures per year equal the number of drives times annual run hours, divided by MTBF. Forty drives at 8,000 hours a year on a 50,000-hour MTBF expect about 6.4 failures a year, which sets spare stock levels and tells you how many emergency call-outs your team can absorb without borrowing from planned work. For a wider look at how that figure sits alongside inspection strategy and spare-part policy, this guide to plant reliability engineering covers the surrounding decisions.
Treat all of it as planning arithmetic. The curve assumes failures arrive randomly and steadily, and no individual drive is obliged to follow it.
What MTBF Cannot Tell You About Drive Life
The most expensive misreading is also the shortest one: that MTBF is the number of hours a drive will deliver before it fails. A drive quoted at 50,000 hours is not promising 50,000 hours of service, and teams that schedule a rebuild or a replacement around that figure get the timing wrong in both directions.
A reliability guide to MTBF calculation makes the point directly: MTBF is an average exposure statistic for repairable assets, and it doesn't predict a particular drive's useful life or its next failure.
That matters because of what the average assumes. MTBF is normally calculated on a roughly constant, random failure rate. Drives don't age that way. Thermal stress on power modules, electrolyte drying inside DC-link capacitors, bearing wear in cooling fans, dust and carbon black bridging creepage paths, salt air in coastal cabinets, repeated overloads and harmonic distortion all push failure probability upward as the years pass. The average cancels that curve out.

Picture a line with six identical drives and a fleet MTBF that looks perfectly healthy. Five sit in a clean, air-conditioned electrical room. The sixth lives in a corner where the cabinet fan has been slowing for a year and the ambient temperature climbs every August. The fleet figure is accurate and useless for that sixth drive.
Track evidence instead of averages:
- Rising alarm counts on the same unit, even for alarms that clear themselves.
- Cooling fan current, which drifts upward as bearings wear and airflow drops.
- Cabinet temperature trend compared with the commissioning baseline, not the room temperature.
- Component age for fans and DC-link capacitors, which are the parts that usually mark the move into wear-out.
The question that replaces "what's the MTBF" is this one: which failure modes are increasing, under what operating conditions, and what evidence shows the remaining risk?
A drive can run four years without a trip while sitting well inside its wear-out period. Hours without a failure are not evidence of hours remaining.
Using MTBF in VFD Asset Management
MTBF earns its place when it's read next to the metrics that fill in what it misses. No single number carries a maintenance programme.
| Metric | What it tells you | How it can mislead |
|---|---|---|
| MTBF | How often failures occur while the drive is running | Depends on the failure rule and the run-hour basis |
| MTTR | How long a repair takes to restore running | Can look good when fast restarts hide repeated faults |
| Availability | Share of scheduled time the drive is available | Can hide frequent short trips that never stop production |
| Failure-mode count | Which causes repeat, such as heat, dust or cooling fans | Needs consistent fault coding to be useful |
Use the number to rank drives and groups by failure frequency, so inspection and spare budgets go to the worst performers first. Use it again to judge whether a change worked, comparing before and after on the same failure rule. A 2025 refractory-production study published in the Journal of Industrial Engineering shows the method in action: MTBF for a 1,600-ton press rose from 4.93 hours in June 2023 to a peak of 24.25 hours in August 2024, roughly a fivefold gain. The press isn't a drive, so read it as a template for the comparison rather than a drive benchmark.
Drive fleets move the same way when the cause gets fixed. At Hangzhou Iron & Steel, repeat failures on a group of ABB drives aged 7 to 12 years fell from 2 to 3 times a month to about once every six months after a two-month maintenance contract.
One habit keeps the comparison honest: group drives by voltage class, location and duty cycle before you rank them. A single harsh site, whether that's a foundry aisle or a coastal pump house, will drag a fleet average down and hide good performance everywhere else. For the wider picture of how reliability metrics feed replacement and overhaul decisions, see this guide to industrial asset management.
Set Up an MTBF Baseline for Your Drives
Two identical drives can post very different MTBF figures. One sits in a clean electrical room. The other runs beside a kiln, in heat and dust. The nameplates match. The exposure does not. A baseline records that difference so the number stays an average of past running hours per failure, not a promise of how many years are left.
Set the baseline once, then keep it. The sequence below is the whole job.
- Write the failure rule and the data boundaries on one page. State what counts as a failure, which hours count as run hours, and which events are excluded.
- Pull 12 months of trip logs, alarm history and run hours for every drive. Export the raw records before anyone summarizes them.
- Calculate MTBF per drive and per fleet group, and record the failure count behind each value.
- Add MTTR, availability and a failure-mode count to the same report. Keep the columns fixed month to month.
- Flag drives with rising failure frequency or repeated same-cause faults for a condition assessment.
- Schedule planned preventive maintenance once or twice a year, and more often for equipment in high-dust, high-temperature, high-humidity or corrosive conditions.
The baseline is only as good as the records feeding it. Each repair record should carry the fault diagnosis, the corrective actions performed, restart and functional-check results, and any open risks with follow-up recommendations. That is the record Rapid Restore hands back after an unplanned fault. Preventive care ends with a written maintenance report from the shutdown. A baseline built from incomplete repair records undercounts failures and makes MTBF look better than the plant deserves.
Treat the first calculation like an odometer reading, not a warranty date. Recompute quarterly and compare against that first baseline, so the trend is measured rather than assumed. When a group of drives is clearly past its reliable middle age, assess what can be maintained and renewed before anyone commits to replacing whole units.
If trip logs sit in three systems and the MTBF figure in the last report is older than the drives it describes, start with the records. DUCHENG Industrial provides preventive care with a written maintenance report, and fault records that feed a drive history. Visit DUCHENG Industrial to discuss a preventive maintenance plan for your fleet.