
What Is SCADA System? Learn the core components, how data flows from field devices to operators, and how it links to VFDs.
SCADA (Supervisory Control and Data Acquisition) is a computer system that gathers data from equipment spread across a site or region, sends it to a central control point, and lets operators monitor it and issue commands in near real time. Power grids, water networks, pipelines and manufacturing plants all depend on this arrangement, which is why SCADA sits at the center of nearly every large industrial operation you will walk into.
It's 02:14 and a conveyor motor trips. The alarm lands on the control-room screen, the operator calls you, and by the time you reach the motor control center you've half-decided the drive is failing. Then the drive fault log looks clean, the motor turns freely by hand, and the PLC is holding a permissive because a lubrication pressure switch never closed. The drive was never the problem, and nothing on the screen said so.
That gap between what the display shows and what happened is where most confusion about what is a SCADA system starts. People learn it as "the software with the graphics," and that framing makes every troubleshooting conversation harder, because each layer in the stack owns a different decision and each one fails in its own way. SCADA owns the watching and the commanding. The protective devices underneath own the trip itself, and they act on their own logic whether or not the screen is displaying anything.
Table of Contents
- What SCADA Means in Plain Terms
- Core Components and What Each One Does
- How Data Moves from Field Device to Operator
- Common SCADA Architectures and Benefits
- How SCADA Connects to VFDs and Plant Automation
- Misconceptions That Lead to Costly Mistakes
- Reliability, Security and Remote Monitoring Limits
- Confirm the Scope Before Committing to Remote Monitoring
What SCADA Means in Plain Terms
The word carrying the most weight in the name is supervisory. It means the system watches, records and allows intervention. It doesn't mean the system runs the process. A pump keeps its own starter logic, a drive keeps its own control loop, and a safety interlock trips whether or not anyone is watching a screen.
A car dashboard is the closest everyday equivalent. Speed, fuel level, coolant temperature and warning lights sit in one place, readable at a glance while the driver keeps working. SCADA does that for a fleet of assets nobody can walk past in a single shift, spread across a plant, a pipeline or a service territory thousands of square kilometers wide.
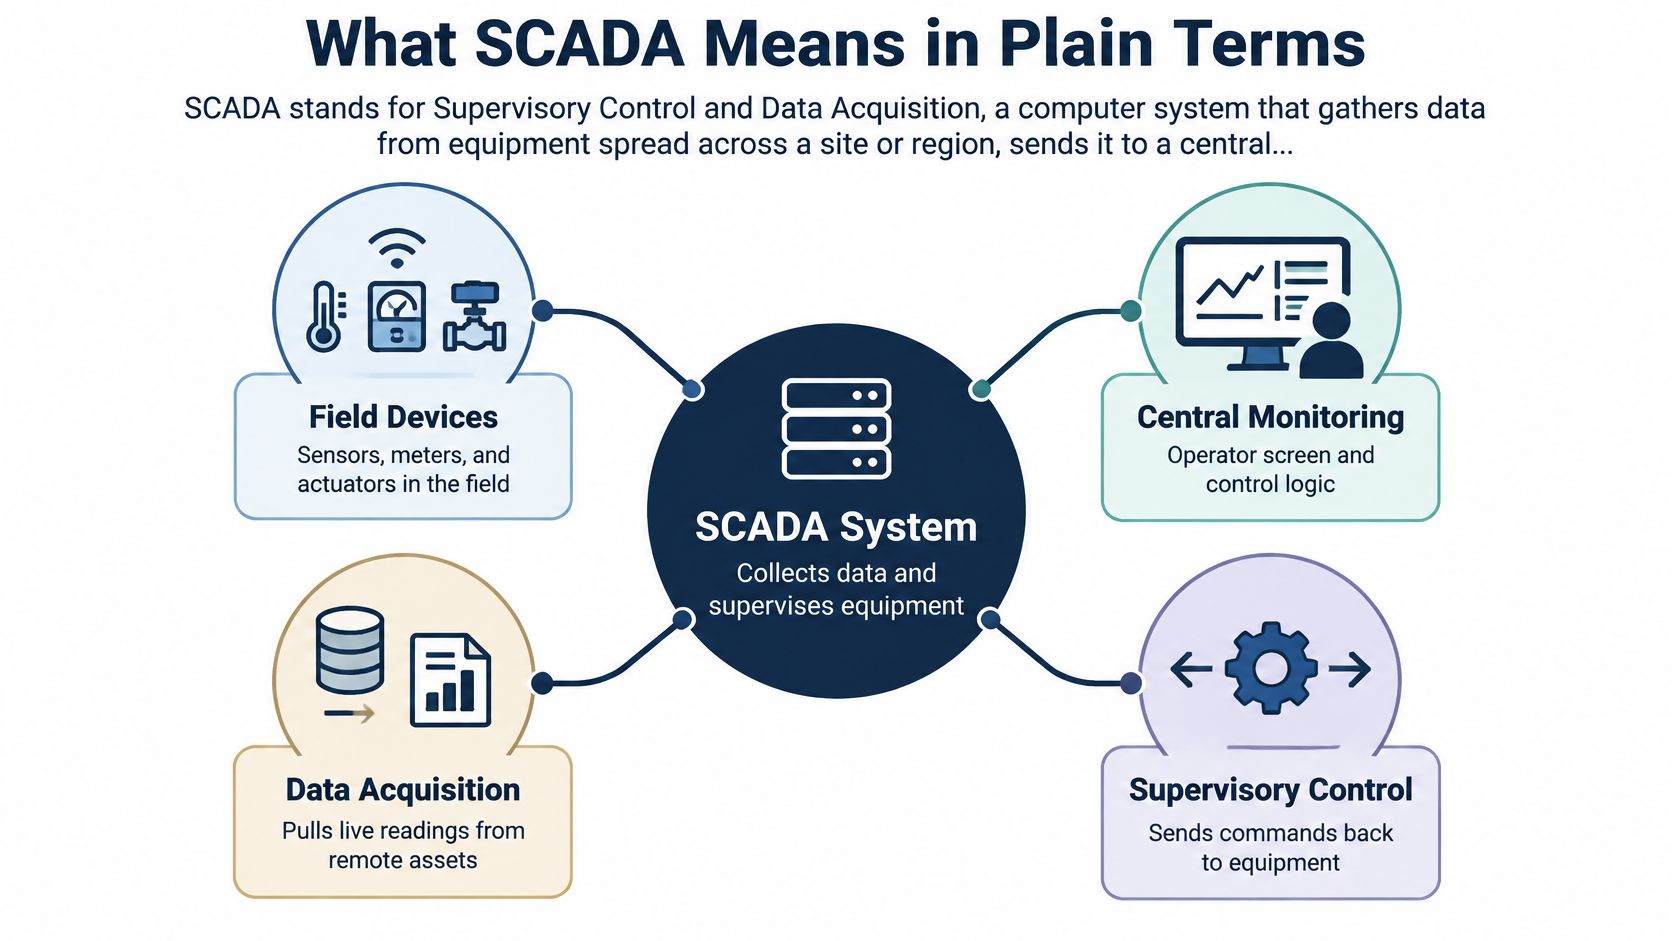
Say a booster pump station sits 40 km from the control room and loses discharge pressure. The pressure transmitter sees it, the RTU or PLC at the station registers the change, and the alarm appears on the central screen within seconds. The operator pulls up the trend, compares discharge pressure against inlet pressure and motor current, acknowledges the alarm, calls the site contact, and only then sends a restart command. That whole loop, from remote measurement to a human decision to a command going back out, is the job in one example.
NIST describes SCADA as integrating data acquisition, data transmission and HMI software into a centralized monitoring and control system for numerous process inputs and outputs (NIST). The same architecture connects process equipment, motor-control systems, drives and protective devices to an operations center, so supervisors can spot abnormal conditions and issue controlled commands without physically visiting every asset.
Where SCADA systems show up
Electric transmission and distribution networks, pipelines, water and wastewater systems, oil and gas production, and process plants all run on this pattern. The common thread isn't the industry, it's geography. Central supervision pays for itself when the number and spread of field assets make individual inspection impractical.
The rule that keeps you out of trouble: SCADA watches and supervises; local controllers do the fast work.
Here's a plain test. If a site has a central screen showing remote assets with live status, alarms and history, all fed from field controllers, it runs a SCADA-type system. If the "central" screen only talks to one machine standing next to it, that's an HMI on a machine, not SCADA.
Core Components and What Each One Does
Here's the parts list, grouped by where each piece physically sits: in the field, at a remote site, on the network between them, and in the control room. Before scanning the rows, hold three roles in mind. Field devices measure and act. Controllers run the local logic. The central server and HMI show and record everything.
| Component | Where It Sits | What It Does | Plant Example |
|---|---|---|---|
| Field sensors and actuators | Field devices | Measure temperature, pressure and current; operate valves and contactors | Bearing temperature sensor feeding a motor alarm |
| Remote terminal unit (RTU) | Remote site | Collects local signals and sends them over a communications link | Valve station on a pipeline or pump site |
| Programmable logic controller (PLC) | Field or plant floor | Runs local control logic and interlocks | PLC permits a drive start only when pressure is confirmed |
| Communications network | Between field and control room | Carries data over industrial Ethernet, radio or telephone links | Ethernet link from the motor control center to the server |
| Central server or master terminal unit | Control room | Aggregates status, alarms, measurements and events | Server polls every drive on the site |
| Human-machine interface (HMI) | Control room and plant floor | Shows graphics, trends and alarm lists to operators | Drive screen showing speed, current and trip codes |
| Data historian | Central server | Stores time-stamped values for later analysis | Ninety days of drive current trends |
| Engineering workstation | Engineering office | Configures logic, screens and alarm limits | Updating speed-reference limits under change control |
| Gateway to enterprise systems | Network edge | Passes operating data to business systems | Energy values sent to reporting software |
The distinction readers most often miss is the drive itself. A variable frequency drive is a field device with its own internal controller, not part of SCADA. It manages motor current, speed, torque and protective trips on its own. SCADA reaches it either through the PLC or over a direct communications link, and it reads and writes values without ever taking over the control loop.
When you audit an existing site, start in three places. The communications link, because most "SCADA is down" reports are network problems. The historian, because gaps in stored data tell you when collection stopped. The alarm list, because a list nobody has pruned in two years hides the signals that matter.
How Data Moves from Field Device to Operator
Follow one conveyor motor trip all the way through the system. Seven stages, in order.
- Field sensing. A current transformer and a winding temperature sensor read the motor, and the signals land on the RTU or PLC input cards.
- Controller scan. The controller scans the input on its normal cycle, time-stamps the value, and compares it against its local limits. If a limit is crossed, its logic responds immediately.
- Transmission. The communications network carries the value to the central server, typically over industrial Ethernet, radio or a leased telephone link. At the physical level that path is often a two-wire RS-485 segment carrying Modbus between drives and controller, and its wiring rules matter as much as the software above it (RS-485, RTU and Modbus field wiring).
- Server update. The server refreshes the HMI screen and raises an alarm object if the tag is in alarm state.
- Historical record. The historian writes the value with its timestamp so anyone can review the trend tomorrow, next week or during an incident investigation.
- Operator action. The operator acknowledges the alarm, checks related tags, and decides whether a set-point change or command is appropriate.
- Command return. The command travels back down the same path, the PLC checks its permissives, and the drive or contactor executes.
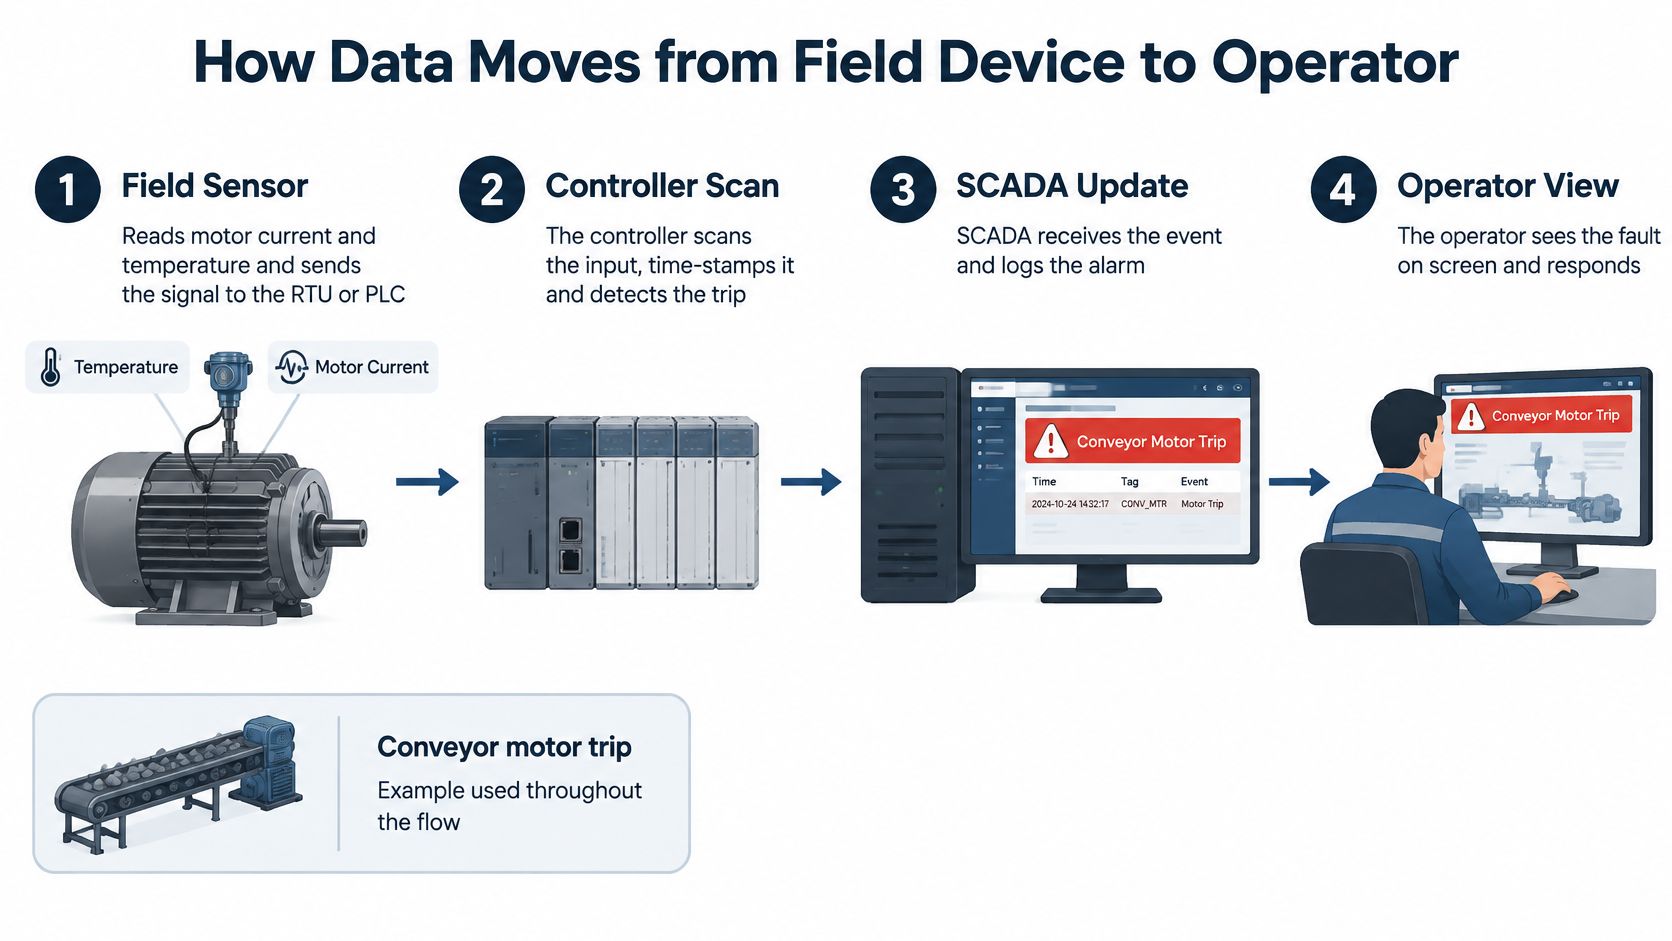
Notice who owns each decision in that chain. The drive detects overcurrent and trips inside its own fast loop in milliseconds. The PLC registers the trip on its next scan. SCADA displays it a second or two later. Supervision is always slower than local protection, and it has to be, because a network round trip can never sit inside a protective trip. If the link fails at stage three, the drive still protects the motor and the PLC still runs its logic. Only the visibility disappears, which tells you exactly what a supervisory layer is for: watching, deciding nothing on the equipment's behalf.
That is why a clean drive log alongside a faulted PLC permissive is a normal finding. The drive recorded what it saw, the PLC recorded why it never allowed the start, and SCADA showed you the symptom first because that is the layer built for human attention.
Trace any alarm back through these seven stages and you will find the point where information was delayed, dropped or never produced. That point is the actual failure, even when it is not the one on the screen.
Common SCADA Architectures and Benefits
SCADA became a significant industrial technology in the 1960s, when digital computing and telecommunications replaced purely manual supervision of remote assets. One documented early deployment was commissioned by Getty Oil in Bakersfield, California, to monitor more than 2,000 oil wells and operate over 100 steam generators (CAE). Those figures explain the original business case exactly: central supervision earns its cost when field assets are too numerous and too far apart for individual inspection.
Three architectures cover most plants today, and they differ less in software than in where the intelligence sits.
| Architecture | Typical Layout | Best Fit | Main Limit |
|---|---|---|---|
| Single-site centralized | One control server, HMIs and PLCs on one plant network | One plant or station with co-located assets | A server outage removes supervision for the whole site |
| Distributed multi-site | RTUs and PLCs at remote sites linked by radio, telephone or Ethernet to one control room | Pipelines, water networks and substations | Communications links set the update rate and failure exposure |
| Hybrid cloud-edge | Edge gateway runs local detection; central or cloud platform stores trends and compares fleets | Dispersed assets needing both fast local alarms and fleet analytics | Cloud link and data governance must be designed and tested |
The first two exist because of physical distance. The third exists because of a different pressure: analytics teams want long trends and cross-site comparison, while the plant still needs an alarm in under a second when a link is saturated or down.
Mapping the layers
Most sites describe their architecture with the Purdue model, and it's worth knowing the levels by number because alarm triage depends on them. Level 0 is the field devices, sensors and actuators. Level 1 is PLCs and RTUs running control logic. Level 2 is the SCADA servers and HMIs. Level 3 is site operations and historians. Level 4 is enterprise systems. Firewalls or an industrial demilitarized zone sit between the upper and lower boundaries, and crossings are deliberately narrow.
The benefits follow from that structure. Fewer site visits, because status arrives on a screen instead of a van journey. Alarms visible within seconds of the event. One time-stamped historical record that satisfies audits without anyone reconstructing a shift from memory. Faster coordinated response when several assets share a cause, since everyone is reading the same trend at the same time. Every added communications link has to be checked against the segmentation rules below before it goes live.
How SCADA Connects to VFDs and Plant Automation
A 500 kW fan drive makes the relationship clear. The operator enters 45 Hz at the SCADA screen. That value is a supervisory request. It travels to the PLC, which confirms the inlet damper is open and lubrication pressure is proven, then writes the reference to the drive. The drive closes its own fast loop, ramps the fan and holds speed regulation while SCADA watches state, alarms and trends.
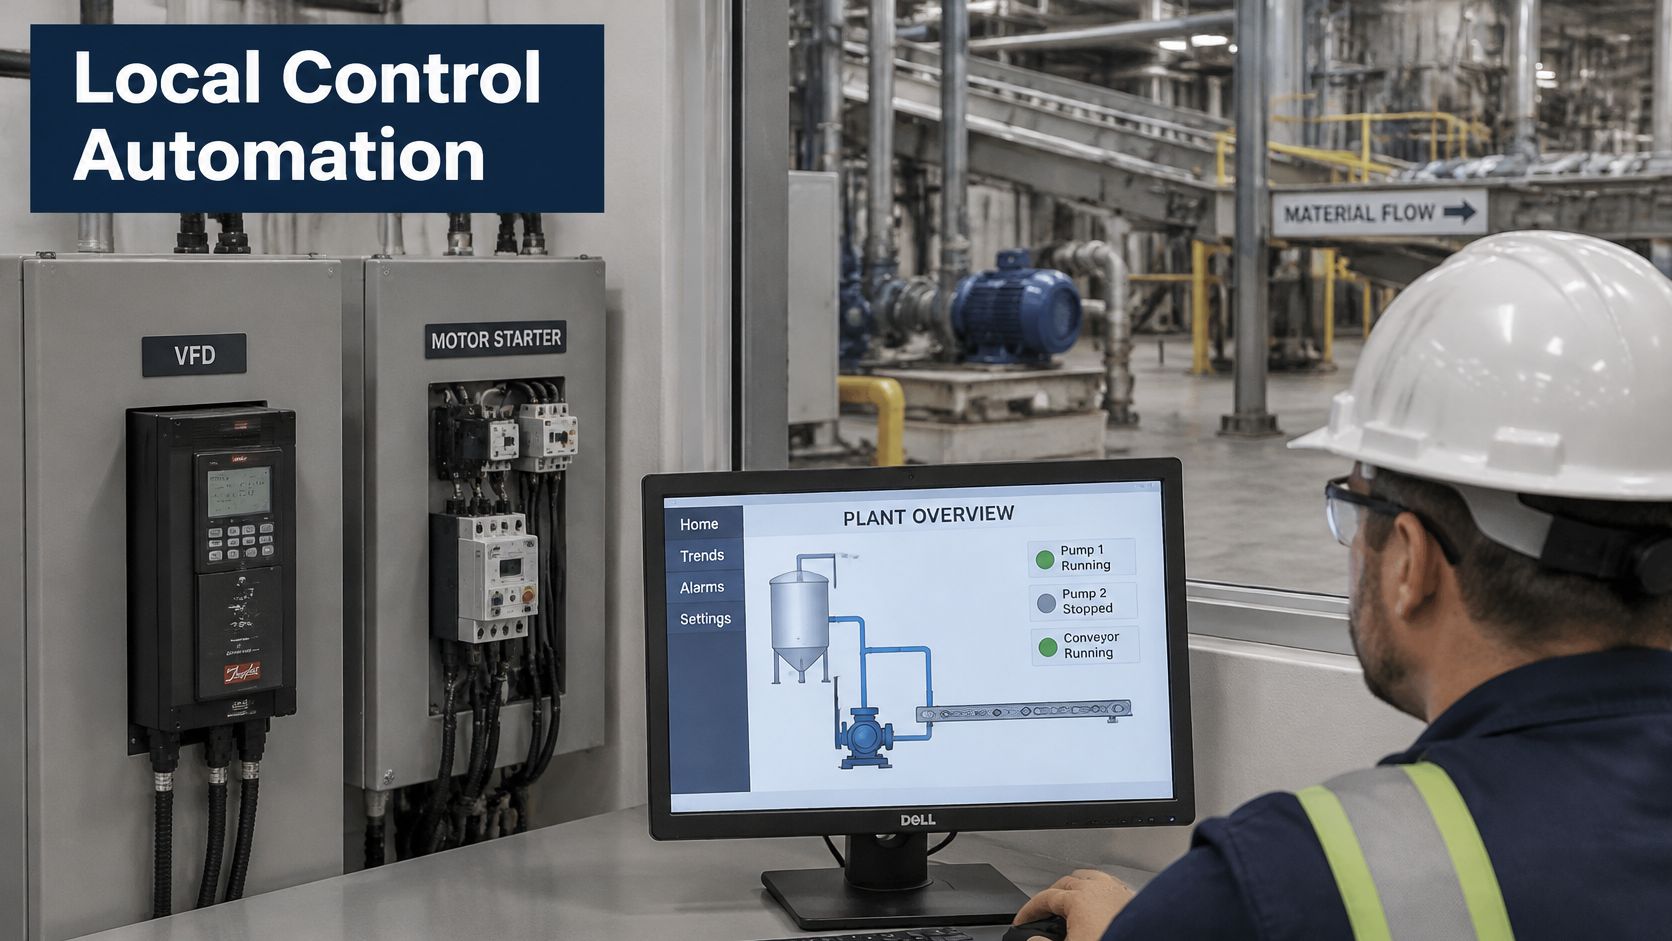
This is the boundary to keep straight. SCADA sits alongside that control. From a drive it typically reads operating state, fault and warning codes, speed reference and actual feedback, motor current, energy values, running hours, and the status of run permissives it reads back. Commands go the other way as speed references or start requests, normally through the PLC so site interlocks are checked before anything reaches the drive.
Who owns the decision when the server goes quiet
If the SCADA server goes offline after that 45 Hz write, the fan keeps running on its last valid reference or moves to whatever fallback the drive and PLC are configured for. Nobody in the control room can change the set-point until communications return, yet the process can continue because protection and regulation never depended on the screen.
That behaviour is a design decision, and it is the one to confirm before connecting any drive to a supervisory system. Four checks cover most of the risk:
- Critical functions stay locally executable, so losing the server never removes protection.
- Quality flags mark stale or failed values, so operators do not trust a number that stopped updating.
- Command confirmation shows the drive accepted the write, rather than assuming it did.
- Time-synchronized event records let a team reconstruct a trip across drive, PLC and server without arguing about clock offsets.
One practical habit separates clean integrators from messy ones. Before any drive goes onto the network, write down which layer owns each decision: who sets the speed reference, who approves a start, who resets a trip, who can command a remote restart. If a name or a layer is missing from that list, the ownership map still has a gap.
Misconceptions That Lead to Costly Mistakes
Four beliefs sit behind a large share of avoidable outages, and each one has a concrete correction.
| Common Misconception | What Is Actually True | Why It Matters |
|---|---|---|
| SCADA is just another name for a PLC or HMI | It is a supervisory architecture linking field devices, networks, historians and HMIs | Buying an HMI and expecting historical records and alarm management |
| A live SCADA screen means the process is fully controlled | The screen can stay live while field control is degraded | False confidence during a fault |
| A drive trip alarm identifies the failed component | The trip may originate in motor load, wiring, PLC logic, settings or the visualization layer | Teams replace the wrong part and extend downtime |
| Adding internet connectivity makes SCADA modern | Legacy protocols such as Modbus and DNP3 often lack built-in security | Remote access becomes an exposure instead of a benefit |
That third row is the expensive one. A drive trip can originate in motor or load conditions, field wiring, PLC logic, communications, protection settings, or the visualization layer itself (Sophos). An alarm identifies a symptom; it does not identify the layer that produced it. Treating the alarm as a component verdict is how good drives get replaced for a wiring fault.
Turning a trip alarm into an owned triage step
Sort every trip alarm to its layer first, using the supervisory level map from the architectures discussion. A fault code on the drive, a permissive bit in the PLC logic and a communication timeout on the server all live on different layers, and each layer has a different owner. Only after the layer is named does anyone touch a component.
Run the sequence on a real event. A drive trips on overcurrent at 2 a.m. The on-call technician reads the drive fault code and its trip history, checks the motor load log for a jam or a mechanical change, and reads the PLC permissive status to see what the controller believed at the moment of the trip. A restart is considered only after those three checks, and the record states which layer caused the trip. Repeat trips on the same asset with the same code get escalated as a load or protection-setting question rather than a drive question.
A SCADA alarm reports a symptom. Naming the layer comes before naming the part.
Three habits prevent most of this. Name the owner of each alarm, one person accountable for triage and restart authority. Label which layer every HMI screen represents, so nobody reads a supervisory graphic as proof of a field-level condition. Review the alarm list after every shutdown, deleting nuisance and stale alarms before they train operators to ignore the list.
Reliability, Security and Remote Monitoring Limits
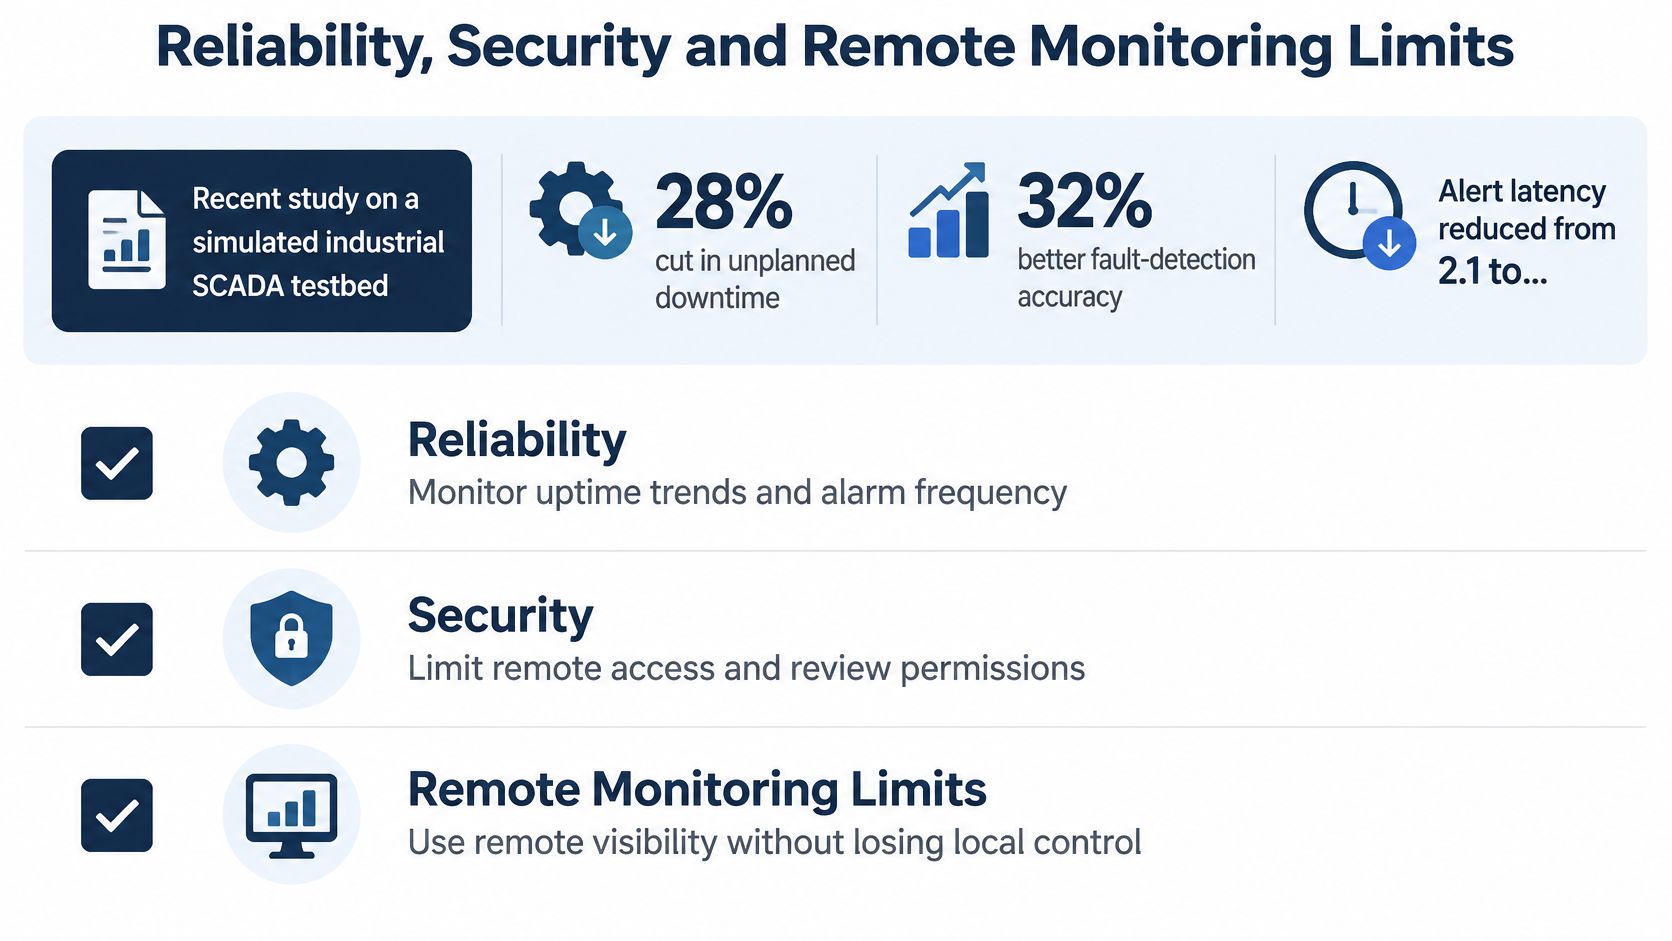
The evidence for predictive maintenance inside SCADA is promising, and narrower than the marketing suggests. Research on a simulated industrial SCADA testbed reported a cloud-edge predictive-maintenance design that reduced unplanned downtime by 28%, improved fault-detection accuracy by 32%, cut alert latency from 2.1 seconds to 0.7 seconds, supported 500 concurrent sensor nodes, and found that only 10% of respondents in a 2025 OT-security survey had full visibility at the supervisory-control level (IEEE).
Treat those figures as a design benchmark. The study ran in a simulated environment, so the numbers that matter for your plant come from validating the approach against your own motors, drives, process loads and network conditions.
Placement of analytics decides whether the system helps or hurts. Edge processing keeps fast local detection running when the link to a central platform drops, which matters for trip detection and interlock monitoring. Central platforms suit historical trends, fleet comparison and model refinement, because they hold more data than any single site generates. A 2024 CFE Media survey commissioned by AVEVA found that 59% of HMI and SCADA decision-makers use or plan to use cloud-based HMI and SCADA within two to five years, making cloud-based supervisory layers a routine architecture choice (AVEVA).
The money is moving the same way. A 2024 Control Engineering survey found that more than 50% of automation professionals expect their cybersecurity budgets to increase during the following two years (Control Engineering).
One limit stays fixed regardless of where the analytics run. SCADA supervises; it does not protect. An overcurrent trip still happens inside the drive itself, and no remote dashboard can stand in for that local protective function. What the supervisory layer adds is the record around the event: who saw the alarm, when they saw it, and what happened next.
Prerequisites before any remote claim
- A complete asset inventory, listing every drive, controller and device that will be visible remotely.
- Network segmentation between the field, supervisory and business networks, with an industrial demilitarized zone instead of a flat network.
- Time-synchronized event records, the same check used in the trip-triage sequence earlier, so a trip can be reconstructed across layers without clock disputes.
- Tested configuration backups and recovery procedures, exercised rather than merely documented.
- Role-based remote access, scoped to the tasks each role performs.
- Human approval for maintenance and restart actions, with a named approver per asset.
The same inventory and segmentation discipline applies to any IoT remote monitoring system before a single sensor is connected. Remote condition monitoring and smart O&M is a service direction DUCHENG assesses project by project, and the scope discussion starts with the asset list and the network before any dashboard enters the conversation. Adding internet connectivity and an AI screen leaves all six items open.
Connectivity is the easy part. Visibility, traceability and a tested recovery path are the work.
Confirm the Scope Before Committing to Remote Monitoring
Four steps turn the ambition into a scoped project.
- Mark the assets whose unnoticed trip would cause lost production or a safety exposure. Those marked assets drive every later decision about data, architecture and access.
- Decide which data you need: alarms, operating values, trends, or maintenance records. Each one implies a different architecture and a different refresh rate.
- Confirm the architecture, connectivity, cybersecurity and data-handling arrangements for every marked asset against the prerequisites above: the asset inventory, network segmentation, time-synchronized records, tested backups, role-based access and human approval for restart actions.
- Record which layer holds restart authority for each asset, so no remote command leaves a workstation without a named approver.
Requirements, system architecture, connectivity, cybersecurity and data management are assessed and agreed separately for each project before any commitment is made. The scope itself can range from condition monitoring and operating data collection to alarm and trend viewing and maintenance records, with the exact scope confirmed per project.
One caveat applies to all of it. Technical guidance doesn't replace the equipment manual or site safety procedures, so the review starts from the existing drive and control documentation on site. Gather the current asset list and alarm list this week. Those two documents are the input every scope review needs.
SCADA supervisory work only holds up when the devices underneath it are healthy, documented and correctly configured, and that's the layer DUCHENG Industrial works on every day. From multi-brand VFD commissioning and troubleshooting to on-site reconditioning of medium and high-voltage drives, our engineers handle the field devices that feed your supervisory system and can review monitoring architecture, connections and data arrangements with your team. Visit DUCHENG Industrial to start a request and put your asset list, alarm list and drive records in front of an engineer.